Figures & data
Figure 1 CD44 overexpression in TNBC CSCs and tissues. (A) 3D mammosphere after 7 days of culture (magnification, ×400). (B) CD44+ CSCs in TNBC 3D mammospheres. (C) CD44 staining in TNBC tissues. The red fluorescence of CD44 was observed on the membranes of most of the tumor cells (excitation 465–495 nm, emission 590 nm). The cell nuclei were visualized as blue fluorescence (excitation 330–380 nm, emission 420 nm).
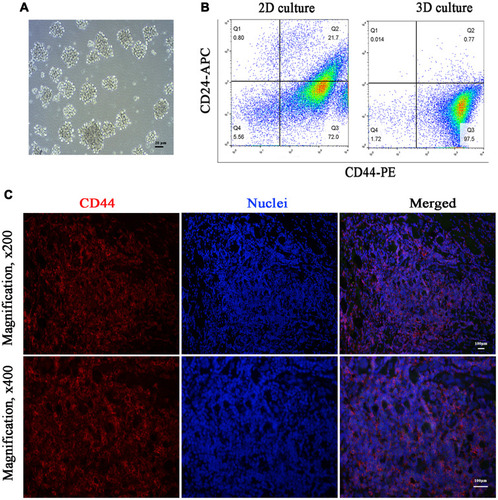
Figure 2 Molecular docking of CD44 and CS. (A) Chemical structures of CD44 and CS. (B) Schema of CS binding to CD44 protein. (C) The amino acid sequence of CD44 that interacts with CS. (D) CD44 interaction with CS via hydrogen bonding.
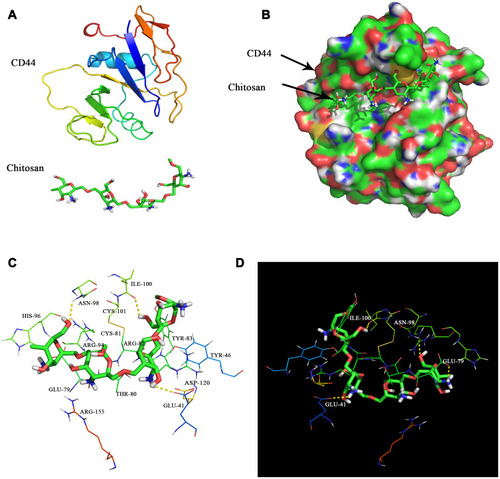
Table 1 Binding Free Energy Between CS and CD44
Figure 3 Molecular dynamics simulations. (A) The RMSD of the simulation calculated over 100 ns. (B) The RMSF of the simulation calculated over 100 ns. (C) The Rg of the simulation calculated over 100 ns.
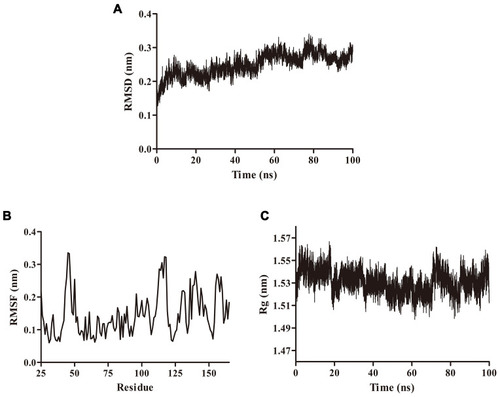
Figure 4 Characterization of CS-MLPs. (A) Morphology of blank liposomes. (B) Morphology of CS-MLPs. (C) Hydrodynamic size of blank liposomes. (D) Hydrodynamic size of CS-MLPs. (E) Stability of CS-MLPs in storage at 4°C for 3 weeks.
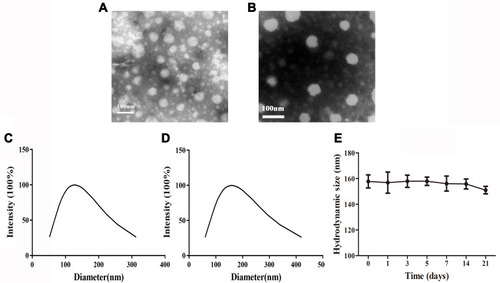
Figure 5 Uptake of CS-MLPs by CD44 overexpressing cells and distribution in vivo. (A) Fluorescence images of the pre-blocking and target groups. (B) Micro PET images of nude mice bearing subcutaneously implanted human xenografts of MDA-MB-231 cells at 4, 8, 24, 48, and 96 h. Images show high levels of 89Zr-labeled CS-MLPs accumulation in the tumor (left side of axillary). Yellow arrows indicate the tumor. (C) Histological images of heart, liver, spleen, lung, and kidney.
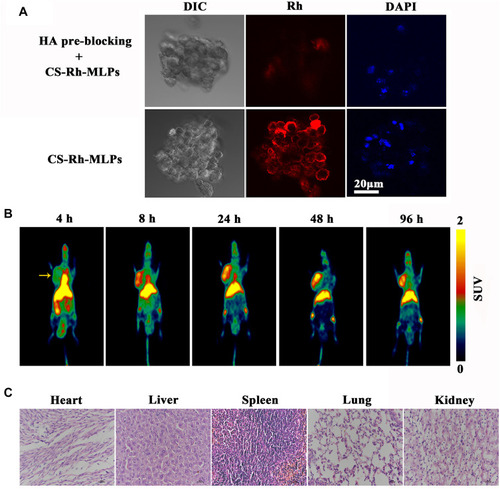
Table 2 Accumulation of Radioactivity (%ID/g) in ROI in the Tissues of Mice at Different Time Points (n = 3, Mean ± SD)
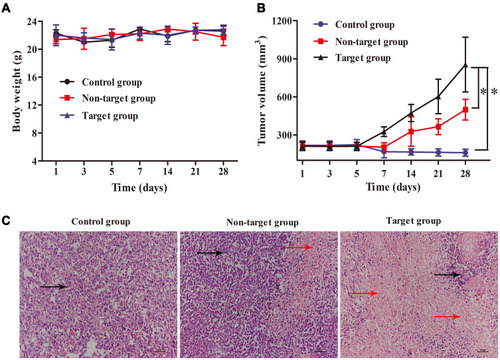
Figure 6 Anti-tumor activity of 89Zr@CS-GA-MLPs in vivo. (A) Body weight of control group, non-target group, and target group during 28 days of treatment. (B) Tumor volume of control group, non-target group, and target group during 28 days of treatment (* p<0.05). (C) Histological images of tumors of control group, non-target group, and target group after 28 days of treatment. Black arrows indicate the tumor tissues, and red arrows indicate the necrosis tissues.
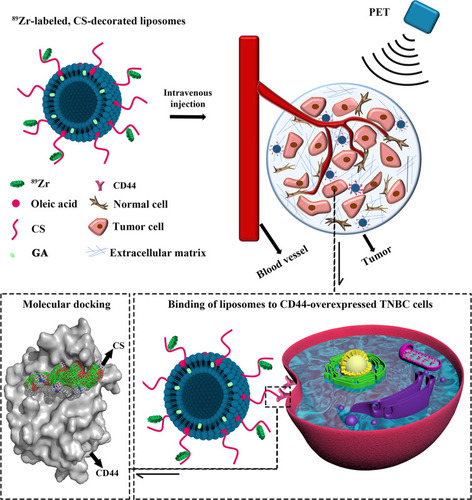
Scheme 1 Scheme of formation, and accumulation of 89Zr-labeled, GA-loaded, CS-decorated liposomes as a multifunctional targeted therapy system. PET imaging was used to trace the biodistribution of liposomes. The binding mechanism was analyzed by molecular docking.