Figures & data
Table 1 Physicochemical Characteristics of Blank Cubosomes and Thymoquinone Loaded Cubosomal Formulation
Figure 1 Transmission electron microscope imaging of thymoquinone-loaded cubosomes.
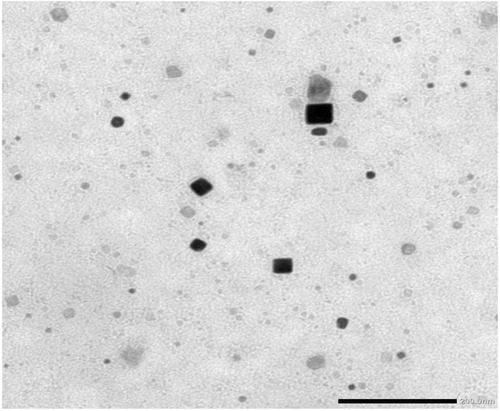
Figure 2 Hemolytic activity and hemolysis percentage of TQ-loaded cubosomes (A) photograph of erythrocytes treated with TQ-loaded cubosomes at different percentage (v/v), (B) photomicrograph of erythrocytes treated with PBS (negative control), TQ-loaded cubosomes, Triton X (positive control), (C) Data expressed as mean ± SD of erythrocytes treated with different percentages of TQ-loaded cubosomes.
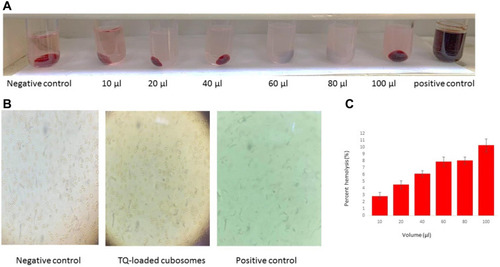
Table 2 Calculated IC50 Values (µm) from MTT Assay of Free TQ and TQ-Loaded Cubosomes in Both MCF-7 and MDA-MB-231 Cell Lines After Treatment with Concentrations Ranging from 1 to 30 µm
Figure 3 Toxicity of TQ-loaded cubosomes to non-tumorigenic breast cells and their anticancer effect in human breast cancer cells in comparison to free TQ. MTT assay showing the viability of (A) MCF-10A normal breast cell line. (B) MCF-7 breast cancer cell line. (C) MDA-MB-231 aggressive breast cancer cell line. The cells were treated for 24 h with different concentrations of either TQ, or blank cubosomes or TQ-loaded cubosomes. Experiments were repeated three times, data are means ± SEM, asterisk indicates p<0.05 with respect to the untreated control, bar and asterisk indicates p<0.05 of TQ-loaded cubosomes with respect to TQ, *p<0.05, **p<0.01, ***p<0.001.
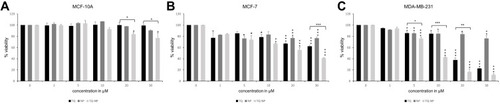
Figure 4 (A) Immunofluorescent analysis of active caspase 3 (AC3) expression in MDA-MB-231 cell line after 24 h of treatment with TQ and TQ-loaded cubosomes using the IC50 values obtained from MTT. Visualized by microscope Zeiss Axio, 40X oil immersion. (B) Active caspase 3 quantification in MDA-MB-231 cell line. Experiments were repeated three times, data are means ± SEM, asterisk indicates p<0.05 with respect to the untreated control, bar and asterisk indicates p<0.05 of TQ-loaded cubosomes with respect to TQ, *p<0.05, **p<0.01, ***p<0.001. Visualized by microscope Zeiss Axio, 40X oil immersion. Arrows indicate apoptotic bodies in the nuclei stained by DAPI.
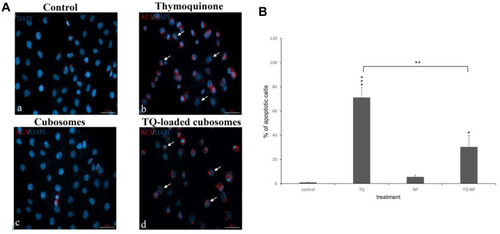
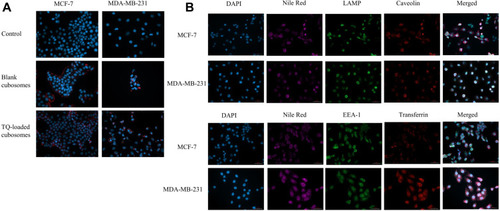
Figure 5 Mechanism of cellular uptake and trafficking of TQ-loaded cubosomes in human breast cancer cell lines. (A) Cellular uptake of the TQ and blank formulations in MCF-7 and MDA-MB-231 cell lines after 30 mins of treatment with the IC50 concentrations. (B) Subcellular localization of TQ-loaded cubosomes in MCF-7 and MDA-MB-231 cell lines. Cells were treated with 27.60 µM (MCF-7) and 7.60 µM (MDA-MB-231) of TQ-loaded cubosomes for 30 mins. The cubosomal formulations were labeled with nile red for tracing inside the cells. Slides were labeled with DAPI, LAMP, Caveolin, EEA-1 and Transferrin. Visualized by microscope Zeiss Axio, 40X oil immersion. Scale is 50 µm.