Figures & data
Figure 1 Scanning electron micrographs of Pluronic® F-108 blended and unblended PLGA microfibrous mesh. (A) Pure PLGA, (B) PLGA blended with 2.0% PF-108 (this is a representative micrograph of blended samples [PF-0.5 to PF-1.5] that are morphologically similar to those reported previouslyCitation20).
Abbreviations: PF, Pluronic® F; PLGA, polylactide-co-glycolide.
![Figure 1 Scanning electron micrographs of Pluronic® F-108 blended and unblended PLGA microfibrous mesh. (A) Pure PLGA, (B) PLGA blended with 2.0% PF-108 (this is a representative micrograph of blended samples [PF-0.5 to PF-1.5] that are morphologically similar to those reported previouslyCitation20).Abbreviations: PF, Pluronic® F; PLGA, polylactide-co-glycolide.](/cms/asset/1686923a-cb00-4169-982b-6565585e6c0b/dijn_a_26453_f0001_b.jpg)
Figure 2 Plot of bovine serum albumin released from PF-0.5 to PF-2.0 blended PLGA microfibrous meshes and pure PLGA microfibrous mesh (control) as a function of time (2, 8, and 24 hours).
Note: *P < 0.001 between unblended PLGA and PF-108 blended PLGA samples at the 2-hour time point.
Abbreviations: PF, Pluronic® F; PLGA, polylactide-co-glycolide; BSA, bovine serum albumin.
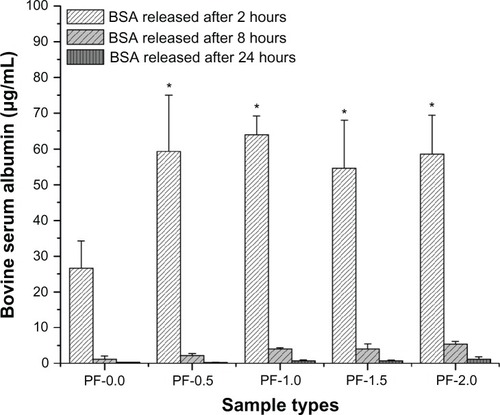
Figure 3 Plot of lysozyme released from PF-0.5 to PF-2.0 blended PLGA microfibrous meshes and pure PLGA microfibrous mesh (control) as a function of time (2, 8, and 24 hours).
Note: *P < 0.001 between unblended PLGA and PF-108 blended PLGA samples at the 2-hour time point.
Abbreviations: PF, Pluronic® F; PLGA, polylactide-co-glycolide.
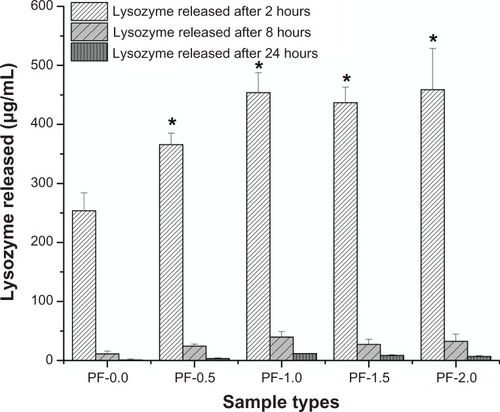
Figure 4 Schematic of PF-108 conformation in/on PLGA microfiber surface. (A) Structure of PF-108 depicting ethylene oxide and propylene oxide domains. (B) Conformation of PF-108 before exposure of water to PF-108 blended PLGA microfiber surface. (C) Conformation of PF-108 after exposure of water to PF-108 blended PLGA microfiber surface. The ethylene oxide component of PF-108 takes on a mushroom-shaped conformation, whereas the propylene oxide component of PF-108 remains embedded in the PLGA microfiber. (D) Noninteracting mushroom-shaped conformations of ethylene oxide on PLGA microfiber surface at lower concentrations of PF-108. (E) Brush-shaped conformations of ethylene oxide on PLGA microfiber surface at higher concentrations of PF-108.
Abbreviations: PF, Pluronic® F; PLGA, polylactide-co-glycolide; EO, ethylene oxide; PO, propylene oxide.
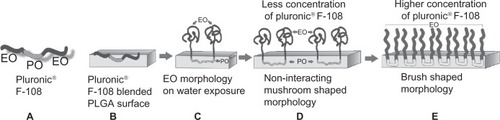
Figure 5 Schematic depicting the cross-sectional view of PF-108 conformation in/on PLGA microfiber surface. (A) Change in conformation of ethylene oxide units of PF-108 from mushroom-shaped to brush-shaped conformation with increase in surface density of PF-108 on PLGA microfiber surface. (B) Primary and secondary protein adsorption behavior on mushroom-shaped and brush-shaped ethylene oxide units.
Abbreviations: PF, Pluronic® F; PLGA, polylactide-co-glycolide; EO, ethylene oxide; PO, propylene oxide.
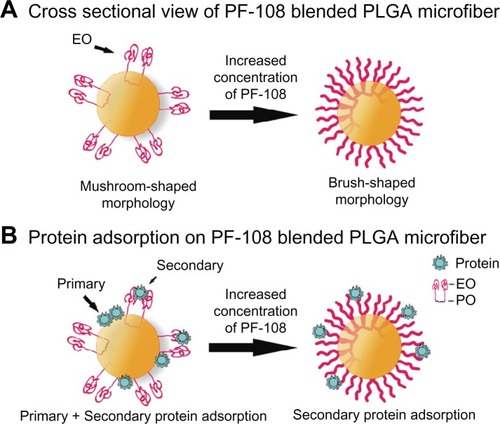
Table 1 Secondary structure of lysozyme content as determined by experimental and deconvolution techniques
Figure 6 Deconvolution spectra of lysozyme amid I peak (1600–1700 cm −1). (A) Complete Fourier transform infrared spectrum of lyophilized lysozyme powder. (B) Zoomed view of amid I peak (solid line in spectrum depicts the amid I region and the dotted lines depict deconvoluted Gaussian peaks of various secondary structures of lysozyme).
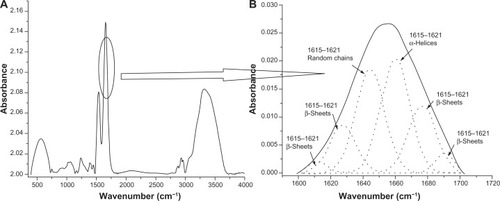
Table 2 Percentage α-helical content of adsorbed and released bovine serum albumin and lysozyme from PF-108 blended and unblended PLGA microfibers (percentage α-helical content of powdered bovine serum albumin and lysozyme were taken as controls)
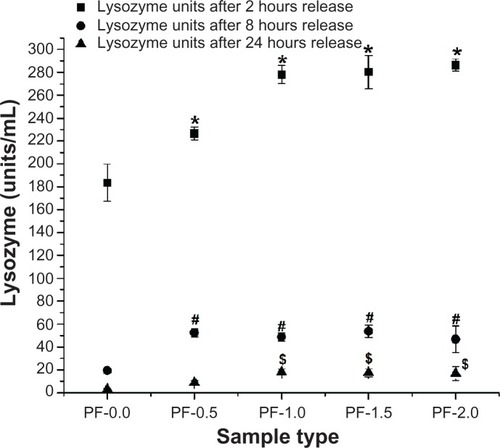
Figure 7 Enzymatic activity of lysozyme (units/mL) released from 0.5%–2.0% PF-108 blended and unblended PLGA microfiber meshes.
Notes: *P < 0.001 (except PF-0.5, P < 0.01) between unblended PLGA and PF-108 blended PLGA samples at the 2-hour time point. #P < 0.001 (except PF-1.0 and PF-2.0, P < 0.01) between unblended PLGA and PF-108 blended PLGA samples at the 8-hour time point. §P < 0.01 between unblended PLGA and PF-108 blended PLGA samples at the 24-hour time point.
Abbreviations: PF, Pluronic® F; PLGA, polylactide-co-glycolide.