Figures & data
Figure 1 (A) Normalized absorbance and fluorescence of multidye theranostic nanoparticles. (B) Normalized ultraviolet-visible absorbance spectra of nanoparticles before (i) and after (ii) loading of silicon 2,3-naphthalocyanine dihydroxide dye. (C) Thermal properties of multidye theranostic nanoparticles. The 785-nm laser irradiated the same aqueous dispersion of multidye theranostic nanoparticles (1 mg/mL) on three separate days demonstrating that the multidye theranostic nanoparticles retain their photothermal properties after activation with near-infrared light. (D) Transmission electron micrograph of multidye theranostic nanoparticles. The porous structure of particles is evident in the image.
Note: Scale bar represents 100 nm.
Abbreviation: MDT-NP, multidye theranostic nanoparticle.
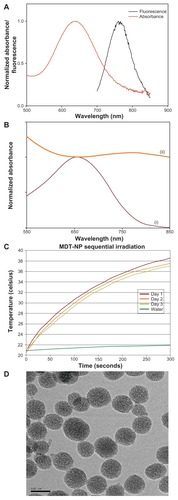
Figure 2 Nine-day time course of normalized fluorescent signal before and after photothermal ablation of control (no ablation) and sequentially ablated groups. This demonstrates persistence of the multidye theranostic nanoparticles within the tumor over 9 days.
Note: Error bars shown represent the standard error of the mean for each measurement.
Abbreviation: MDT-NPs, multidye theranostic nanoparticles.
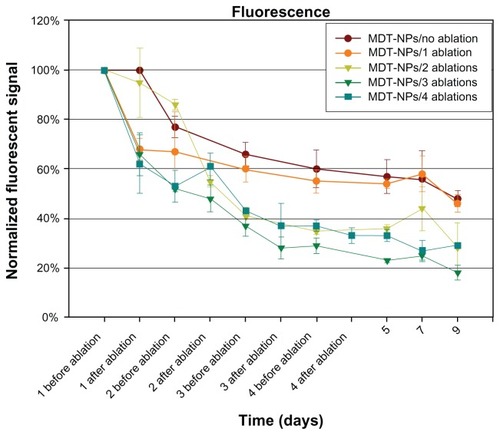
Figure 3 Fluorescence image (710 nm excitation/820 nm emission) of a mouse (A) before direct intratumoral multidye theranostic nanoparticle injection, (B) after injection, and (C) after photothermal ablation on day one. This representative mouse underwent daily photothermal ablation (multidye theranostic nanoparticle/ four total ablations) with subsequent fluorescent imaging on (D) day two, (E) day three, and (F) day four. The mouse was further imaged on (G) day five, (H) day seven, and (I) day nine to determine fate of multidye theranostic nanoparticles after photothermal ablation. Region of interest is quantified in photons/second. Image acquisition settings: excitation filter = 710 nm, emission filter = 820 nm, binning = small, field of view = 13.2 cm, f-stop = 2, exposure = (A) 1, (B) 3, (C) 3, (D) 3, (E) 3, (F) 4, (G) 5, (H) 6, and (I) 6 seconds. Fluorescent in-situ image (710 nm excitation/820 nm emission) of a representative euthanized mouse (J) multidye theranostic nanoparticle/no ablation, (K) multidye theranostic nanoparticle/four ablations, and (L) control/four ablations.
Notes: There is no accumulation of multidye theranostic nanoparticles observed in other organs including the liver and spleen. Image acquisition settings: excitation filter = 710 nm, emission filter = 820 nm, binning = medium, field of view = 13.2 cm, f-stop = 2, exposure = 1 second.
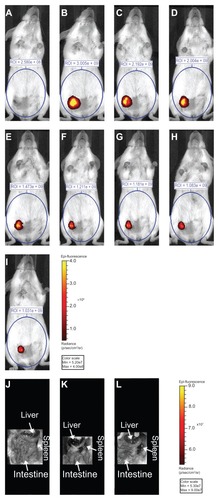
Figure 4 Graph of tumor treatment score in experimental and control mice. Tumor treatment effect was scored in a blinded fashion using a scale of zero (no treatment effect) to four (maximal treatment effect) as determined on experiment day nine.
Notes: Median values are shown with range of values shown in parentheses above the bars. There was a statistical difference in treatment effect score in the treatment groups (P = 0.026).
Abbreviation: MDT-NPs, multidye theranostic nanoparticles.

Figure 5 Digital photographs of tumors from representative mice from each group taken at 9 days of (A) multidye theranostic nanoparticle/no ablation, (B) multidye theranostic nanoparticle/one ablation, (C) control/one ablation, (D) multidye theranostic nanoparticle/four ablations, and (E) control/four ablations. There is significantly greater tumor destruction seen in the sequentially ablated tumor (D) compared to mice receiving one ablation (B) or control mice (A, C, and E).
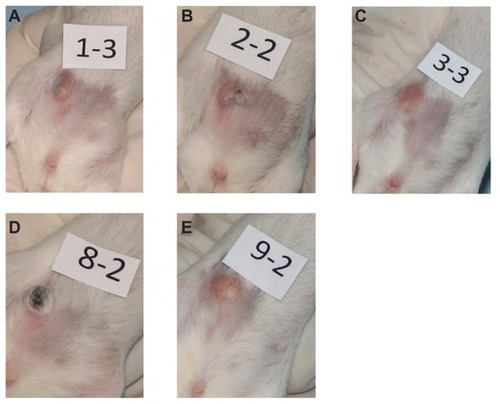
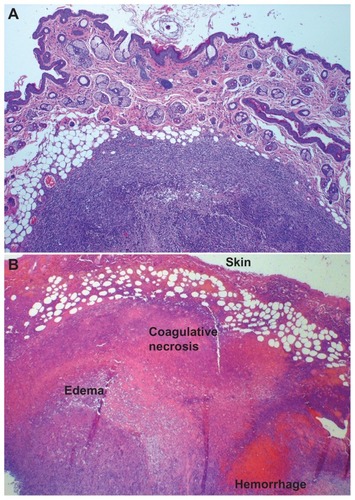
Figure 6 (A) Hematoxylin and eosin stained tumor section of a representative control/four ablations mouse, 4×. There is no evidence of thermal injury or other tissue damage; a viable tumor nodule is clearly demarcated with a healthy skin surface. (B) Hematoxylin and eosin stained tumor section of multidye theranostic nanoparticle/four ablations, 2×. Thermal injury is evident with coagulative tumor necrosis, hemorrhage, and edema in the treated tissues.