Figures & data
Figure 1 Cryo-TEM images of: (A) unloaded GMO cubosomes; (B) drug-loaded GMO-AT101 cubosomes. Insets in images are the FFT and iFFT of the arrowed cubosome showing a diffuse brightness peak, revealing the periodical internal structure of the prepared nanoparticles.
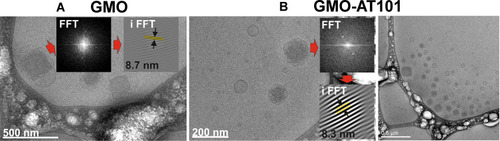
Table 1 Summary of the Results from the DLS/ζ Potential Measurements for Prepared Cubosomal Dispersions After Equilibration at RT for 24 h, Calculated Drug Encapsulation Efficiency (EE %) and Drug Loading Capacity (DLC %)
Figure 2 DLS and zeta potential results for unloaded GMO and drug-loaded GMO-AT101 cubosomes showing: (A) Z-average, (B) particle diameter (d(number)), (C) polydispersity index (PdI), (D) ζ potential over a time and for two different storage temperatures RT and 37°C. In panels (E) and (F) particle size distribution curves for number and intensity weighted measurements are presented, respectively.
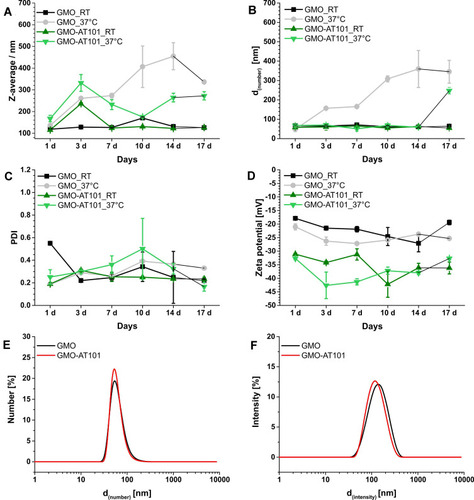
Figure 3 AT101 release profile from GMO cubosomes (mean±SD, n=3) in aCFS solution at 37°C presented as the cumulative amount of released drug vs time (up to 72 h) (A) and vs the square root of time (B).
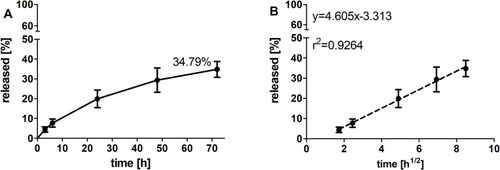
Figure 4 1H NMR 1D spectra and corresponding Fourier transformed 2D PGSE NMR spectra vs the increasing magnitude of the pulsed field gradient. (A and D) AT101 drug in methanol. (B) 1D spectra of GMO cubosomes in the region of the AT101 signal. (E) 2D spectra in the range of chemical shifts used for further analysis of GMO diffusion coefficients. (C and F) GMO cubosomes with AT101.
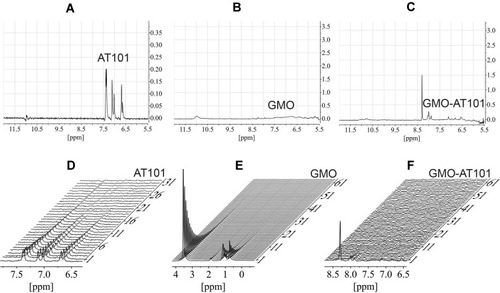
Figure 5 The detailed analysis of 2D PGSE data from . (A) AT101 diffusion decay from , the self-diffusion coefficient is shown in the figure. (B) The diffusion decay from , the distribution of self-diffusion coefficients of GMO was obtained from 2D Bayesian DOSY display shown as an inset. (C) The diffusion decay of AT101 in a GMO/water system taken from line intensity at 8 ppm, the self-diffusion coefficient corresponds to the diffusivity of GMO. (D) Overlaid data points from AT101 in GMO (B) and GMO (C).
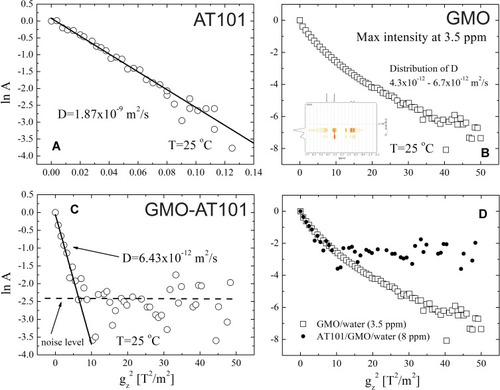
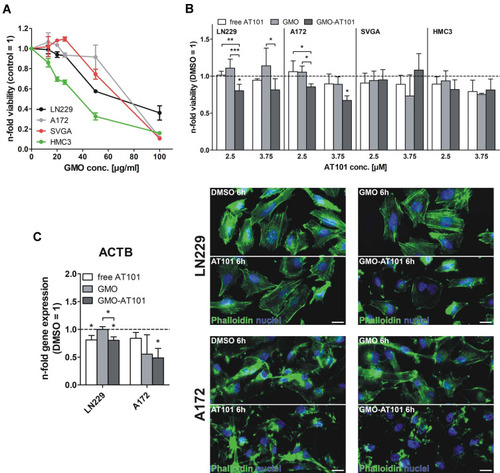
Figure 6 Uptake of GMO-AT101 cubosomes into 3D glioma spheroids and cell layers of A172 and LN229 cells. 3D spheroids were produced by the hanging drop technique and further cultivation of cell aggregates on 1% agarose over six days. Prior to stimulation, GMO-AT101 cubosomes were fluorescently stained with 5 µg/mL Nile Red for 24 h. Spheroids and native cells were seeded onto coverslips and stimulated with 26 µg/mL GMO-AT101-Nile Red for 24 h. Finally, glioma cell spheroids were further stained with concanavalin A to enable membrane identification, while the cell bodies of native cells were visualized with β-catenin (green). Nuclei were marked with Hoechst (blue). White bars indicate 50 µm (n=2). White arrows in the images point the area where the nanoparticles were successfully incorporated into cells.
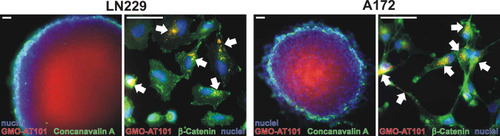
Figure 7 Cytotoxic efficacy of GMO-AT101 cubosomes compared with free AT101 in GBM cells, astrocytes and microglia, as well as cytoskeletal rearrangement after treatment. To estimate the biocompatibility of empty cubosomes, LN229 and A172, SVGA and HMC3 cells were stimulated with 13 to 200 µg/mL GMO cubosomes for 72 h. The n-fold viability was measured by WST-1 assay (n=3, A). Additionally, different concentrations of encapsulated AT101, free drug and blank cubosomes, respectively, compared with DMSO were applied to tumor and normal brain cells. Cytotoxicity was analyzed in the same manner (n=3-4, B). (After 6 h of treatment of LN229 and A172 cells with 26 µg/mL GMO-AT101 cubosomes or the same concentrations of free AT101, empty cubosomes and DMSO, actin rearrangement was visualized by phalloidin (green), and the nuclei were stained blue with Hoechst (blue) (n=2, C). White bars indicate 20 µm. Furthermore, the transcriptional regulation of ACTB was determined after 24 h of stimulation. The induction of gene expression by stimulation is displayed as relative gene expression (DMSO=1; n=3, C). *p<0.05, **p<0.01, ***p<0.001.