Figures & data
Scheme 1 Schematic illustration of the GO@SiO2@AuNS hybrid formation for photothermal therapy of cancer cells.
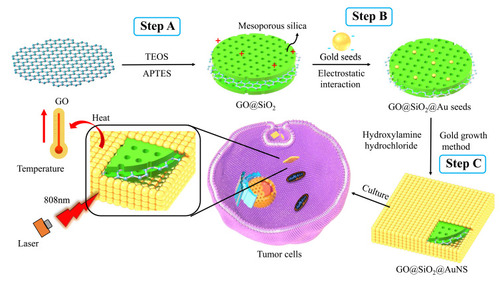
Figure 1 SEM images and size distribution of GO (A), GO@SiO2 (B), GO@SiO2@Au seeds (C) and GO@SiO2@AuNS with different amount of 1 mL (D), 2mL (E) and 4 mL (F) of HAuCl4. The right panels are the size distributions of these nanomaterials by measuring at least 100 nanomaterials.
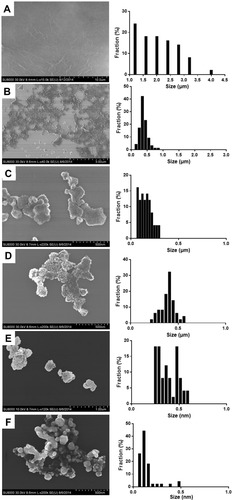
Figure 2 Hydrodynamic diameters (A) and zeta potential (B) of the synthesized nanomaterials.
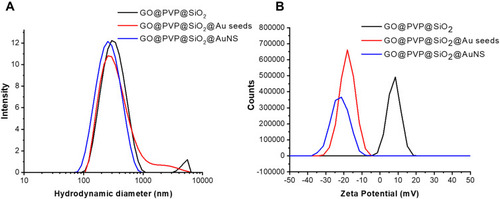
Figure 3 EDS map pattern and spectrum of the GO@SiO2@AuNS hybrid.
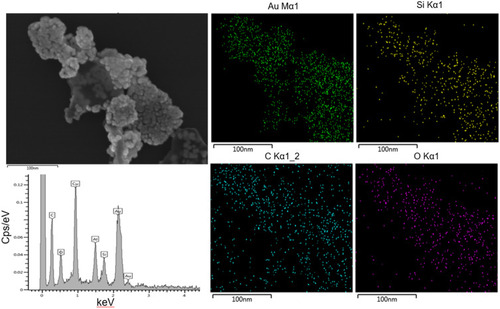
Figure 4 The absorption spectra of the synthesized nanomaterials.
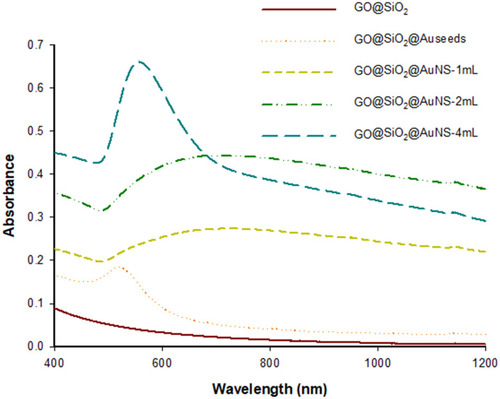
Figure 5 (A) The absorption spectra of GO@SiO2@AuNS hybrid at different concentrations (a-g: 0.150, 0.075, 0.038, 0.019, 0.009, 0.005, to 0.002, mg/mL). (B) Linear relationship between the absorbance at 808 nm and the concentration of GO@SiO2@AuNS hybrid.
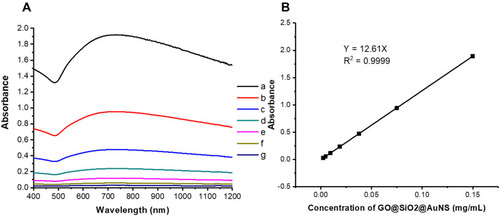
Figure 6 The heating curves of water (a), cell culture medium (b) and different concentrations of GO@SiO2@AuNS hybrid (c to e: 0.05, 0.10, and 0.15 mg/mL).
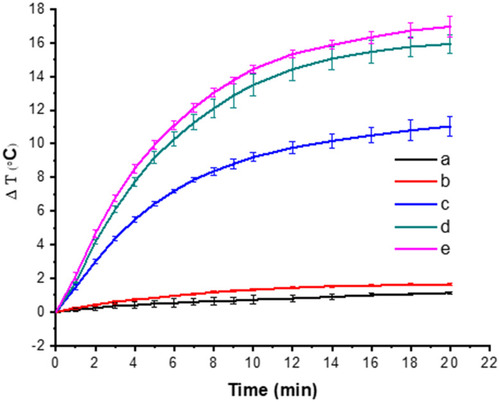
Figure 7 (A) Normalized absorption spectra of GO@SiO2@AuNS hybrid before and after laser irradiation (0.3 W/cm2 for 1 h). (B) Temperature changes of 0.15 mg/mL GO@SiO2@AuNS hybrid under 808 nm laser irradiation for three cycle with the power density of 0.3 W/cm2 (20 min of irradiation for each cycle).
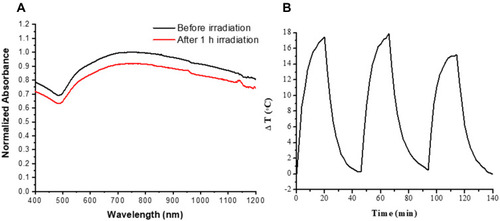
Figure 8 Relative cell viability after culturing with different concentrations of GO@SiO2@AuNS hybrid varying from 0, 1, 5, 10, 25, 50, 75, and 100 µg/mL for 24 h at 37°C.
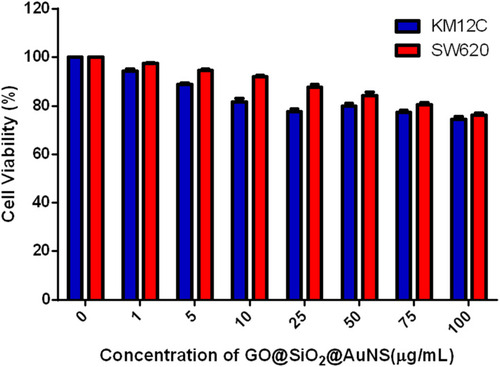
Figure 9 Relative cell viability after treatment of different concentrations of GO@SiO2@AuNS hybrid in the presence or absence of NIR irradiation. - stands for no treatment. For the concentration of GO@SiO2@AuNS hybrid, +, ++, and +++ represent the concentrations at 10, 50, and 100 µg/mL, respectively. For the laser irradiation, + represents 20 min NIR irradiation at 808 nm with 0.3 W/cm2.
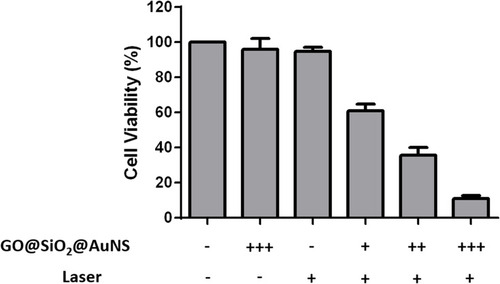
Figure 10 Fluorescence images of KM12C cells treated with different conditions: (A) without any treatment; (B) 20 min light exposure; (C) 100 µg/mL GO@SiO2@AuNS hybrid; (D) 10 µg/mL GO@SiO2@AuNS hybrid and 20 min light exposure; (E) 50 µg/mL GO@SiO2@AuNS hybrid and 20 min light exposure; (F) 100 µg/mL GO@SiO2@AuNS hybrid and 20 min light exposure. The power intensity of light exposure was 0.3 W/cm2. After the treatment, the cells were stained with Vybrant Apoptosis Assay. The green fluorescence from YO-PRO-1 showed the apoptotic cells, and the red fluorescence from PI showed the necrotic cells. Scale bar = 100 µm. A 20 X objective was used to capture the images.
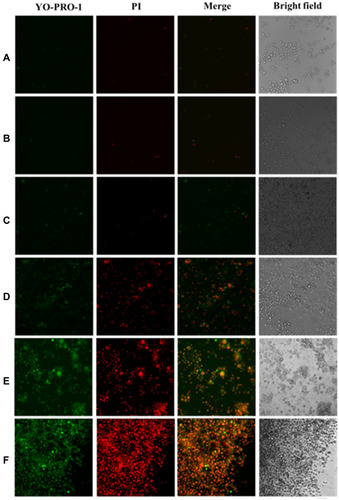
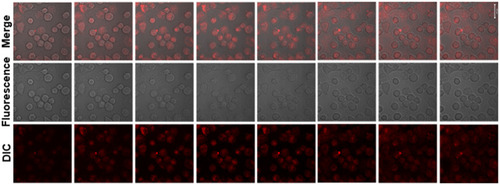
Figure 11 Confocal fluorescence images (Z-stack) of KM12C cells with the internalization of TAMRA doped GO@SiO2@AuNS hybrid. KM12C cells were incubated with TAMRA doped GO@SiO2@AuNS hybrid for 6 h at 37 °C before taking the images.