Figures & data
Figure 1 The mechanism underlying the development of Parkinson’s disease.
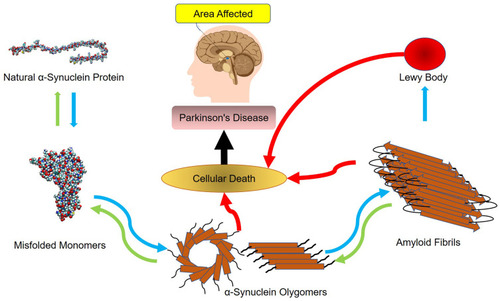
Figure 2 This figure illustrates how α-synuclein proteins change their folding in the absence and presence of each monolayer: (A) Graphene; (B) N-Graphene; (C) P-Graphene; (D) BCN; (E) without monolayer.
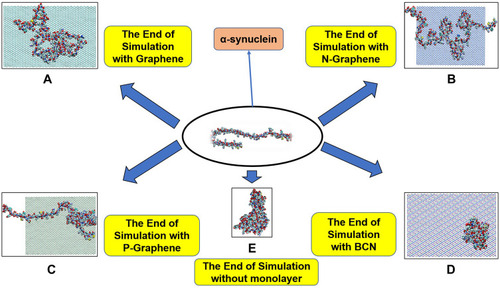
Figure 3 Changes in the α-synuclein structure during the simulation time in the presence of each monolayer.

Figure 4 Van der Waals, electrostatic, and total energy of interactions between α-synuclein protein and each monolayer versus time: (A) Graphene; (B) N- Graphene; (C) P- Graphene; (D) BCN.
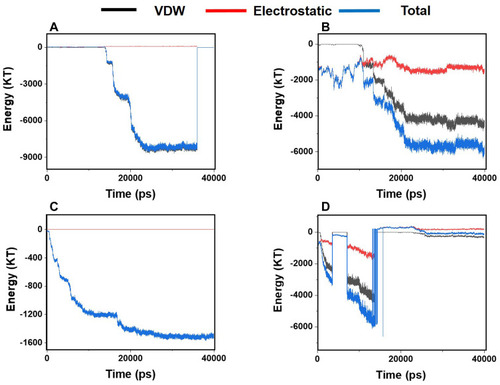
Table 1 Average Values for VDW, Electrostatic, and the Total Energy of Interactions Between α-Synuclein Protein and Monolayers During the Simulation Process Monolayer
Figure 5 Rg of α-synuclein proteins versus the simulation time in the presence of (A) Graphene; (B) N- Graphene; (C) P- Graphene; (D) BCN; (E) Without monolayers.
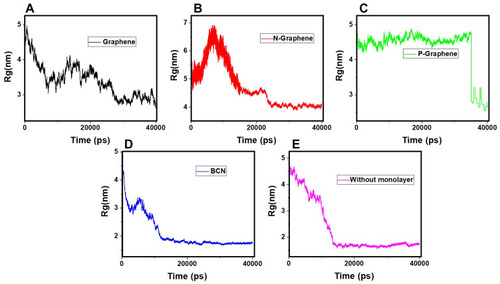
Table 2 Values of the Gyration Radius Variation for α-Synuclein Proteins in the Presence of Each Monolayer
Table 3 The Average Number of Hydrogen Bonds Between α-Synuclein Protein and Water Molecules During the Simulation Time in the Presence of Each Monolayer
Figure 6 The number of hydrogen bonds between the α-synuclein protein and water molecules versus time of simulation in the presence of (A) Graphene; (B) N- Graphene; (C) P- Graphene; (D) BCN; (E) Without monolayers.
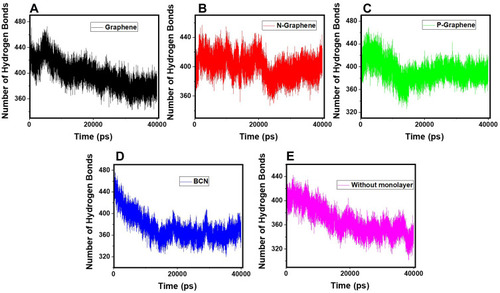
Table 4 The Secondary Structure of the α-Synuclein Protein in the Presence of Each Monolayer
Figure 7 Different components of the secondary structure of α-synuclein protein during the simulation time (colours represent secondary structures) in the present of (A) Graphene; (B) N- Graphene; (C) P- Graphene; (D) BCN; (E) Without monolayers.
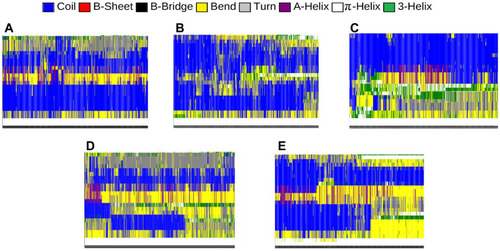
Table 5 Values of the Geometric Means of α-Synuclein RMSD Derivatives in the Presence of Each Monolayer
Figure 8 RMSD values of α-synuclein protein versus the simulation time in the presence of (A) Graphene; (B) N- Graphene; (C) P- Graphene; (D) BCN; (E) Without monolayers.
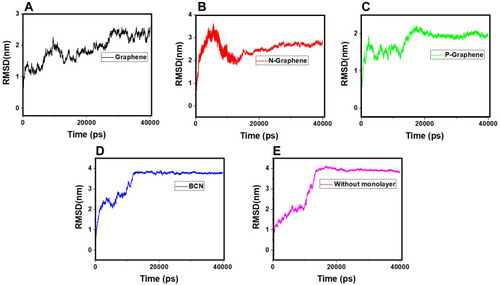
Table 6 Average RMSF Values of α-Synuclein Protein Atoms in the Presence of Each Monolayer
Figure 9 RMSF values of α-synuclein protein versus the simulation time in the presence of (A) Graphene; (B) N- Graphene; (C) P- Graphene; (D) BCN; (E) Without monolayers.
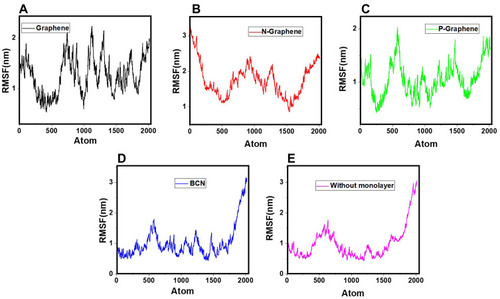
Table 7 Average Values of Contact Area for α-Synuclein Proteins During the Simulation in the Presence of Each Monolayer
Figure 10 The contact area of α-synuclein proteins versus time in the presence of (A) Graphene; (B) N- Graphene; (C) P- Graphene; (D) BCN; (E) Without monolayers.
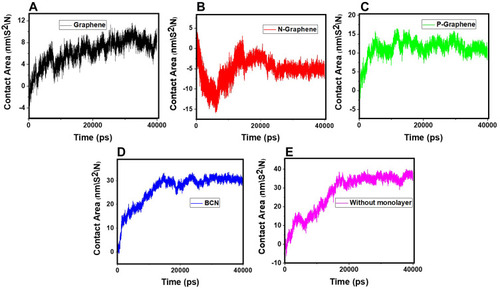
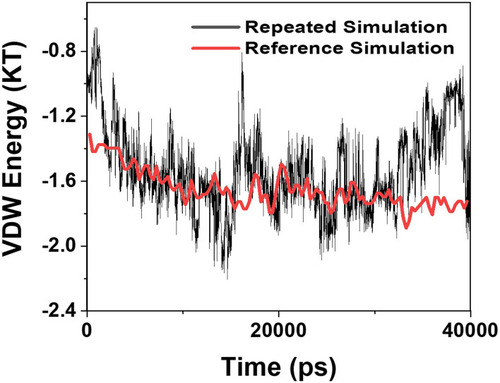
Figure 11 Comparison of the values of VDW between the α-synuclein protein and Graphene polyglycerol versus time in two different studies; black curve: the current study; red curve: the previously published study of Mohammad-Beigi et al.Citation19