Figures & data
Figure 1 Scanning electron microscopy of flower-like silver nanostructures. Structures prepared by varying concentrations of different reagents. (A–C): silver nitrate 2–8 μM, dextrose 3 mM, and sodium hydroxide 0.1 mM; (D–F): silver nitrate 2 μM, dextrose 3–9 mM, and sodium hydroxide 0.1 mM; (G–I) silver nitrate 2 μM, dextrose 3 mM, and sodium hydroxide 0.1–0.5 mM.
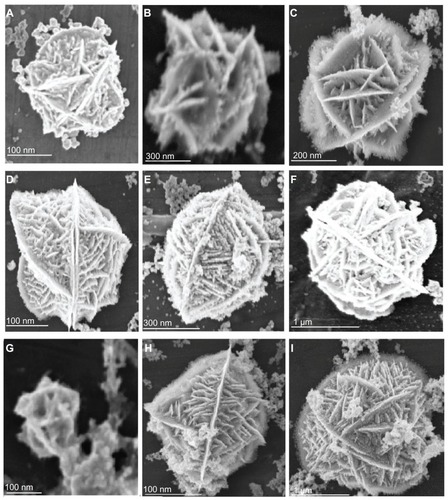
Figure 2 Scanning electron microscopy of flower-like silver nanostructures. (J–M) represent structures prepared by using silver nitrate 2 μM, dextrose 3 mM, sodium hydroxide 0.1 mM, and trisodium citrate 1–6 mM.
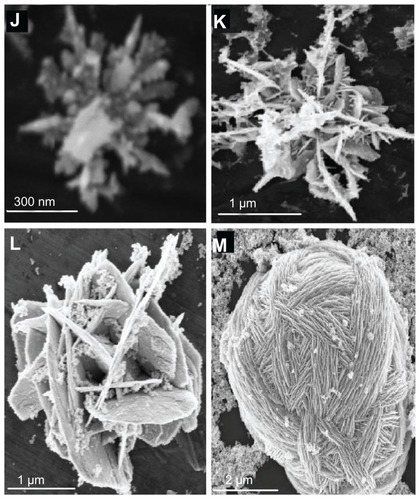
Figure 3 Particle size distributions using various concentrations of silver nitrate (A), dextrose (B), sodium hydroxide (C), or trisodium citrate (D).
Abbreviations: AgNO3, silver nitrate; NaOH, sodium hydroxide; TSC, trisodium citrate.
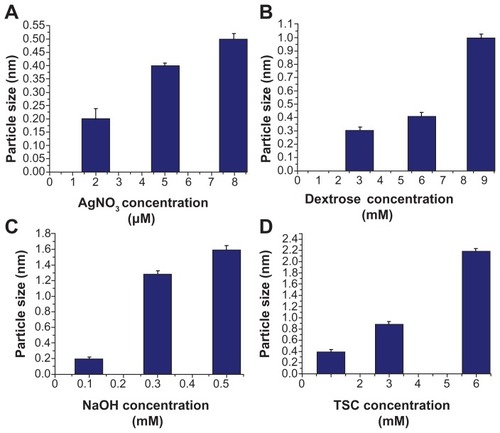
Figure 4 Ultraviolet absorbance spectra of flower-like silver nanostructures prepared using varying concentrations of silver nitrate (A), dextrose (B), sodium hydroxide (C), or trisodium citrate (D).
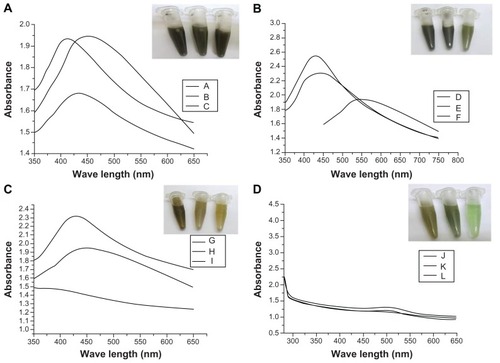
Figure 5 Atomic force microscopy analysis of silver nanostructures. Sample prepared by reacting silver nitrate 2 μM, dextrose 3 mM, and sodium hydroxide 0.1 mM. Surface area, roughness, and surface area diffraction were 49.37 nm2, 33.5 nm, and 14.6%, respectively.
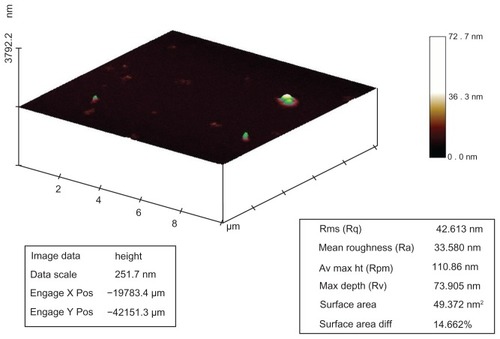
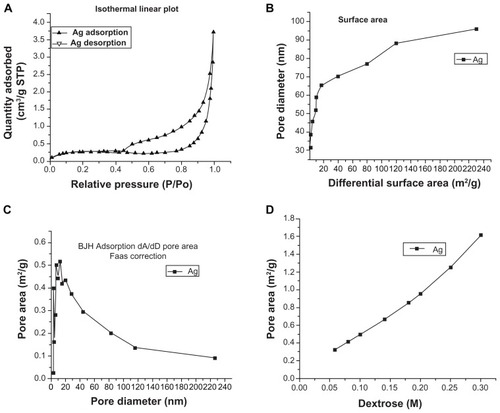
Figure 6 Porosimetry analysis of silver nanostructures. (A) Isothermal linear plot showing adsorbed and desorbed liquid nitrogen on silver nanostructures relative to pressure; (B) surface area calculated by plotting pore diameter against differential surface area; (C) pore area calculated by Barrett–Joyner–Halenda adsorption model and flame atomic absorption spectrometry correction; (D) pore area relative to dextrose concentration.