Figures & data
Table 1 Formulation attributes of nanomicellar quercetin
Figure 1 MTT viability of free (□) and nanomicellar (■) quercetin in A549 human lung cancer cell line upon 72 hours of exposure.
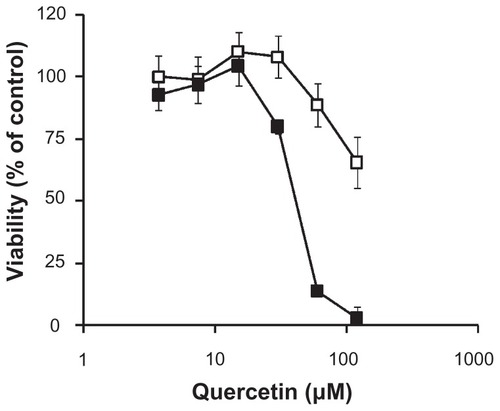
Figure 2 Stability of quercetin nanomicelles in simulated gastric fluid (SGF) and simulated intestinal fluid (SIF).
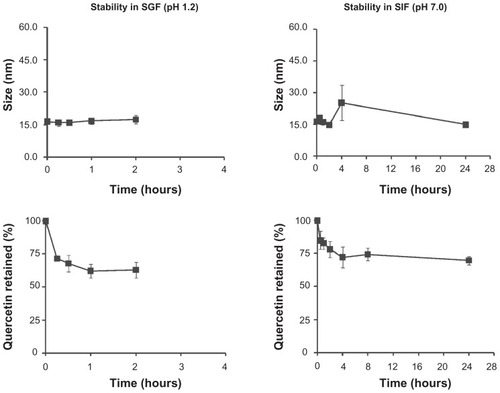
Figure 3 Interaction of quercetin nanomicelles with Caco-2 cells. (Panel A)Cellular accumulation of FITC-labeled nanomicelles over 24 hours of incubation at 37°C Representative images from fluoresence confocal microscopy are shown. (Panel B) Change in TEER upon treatment with quercetin in free (green) and nanomicellar (orange) forms, as well as empty nanomicelles (blue) and 1% triton-X (red), with the arrow indicating treatment duration of 24 hours.
Notes: +, #, *, and ‡ represent P < 0.05 compared to values at t = 0 hours.
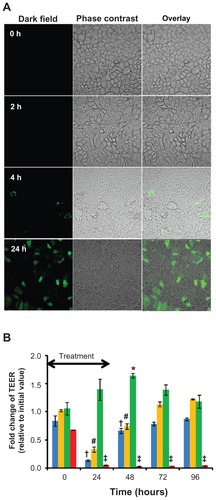
Figure 4 LDH cytotoxicity in Caco-2 cells when treated with free (□) and nanomicellar (■) quercetin for 24 hours.
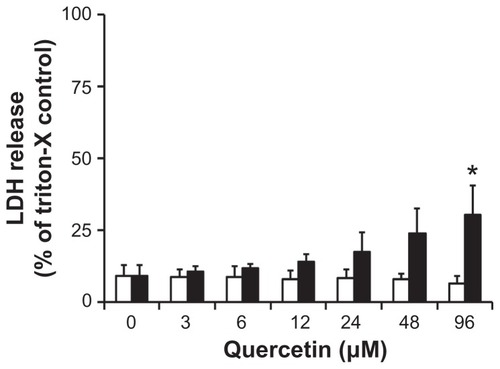
Figure 5 In vivo efficacy of orally given quercetin nanomicelles in subcutaneous A549 lung tumor xenograft murine model. Mice (n = 6) were treated with 30 mg/kg quercetin three times per week for 3 weeks by oral gavage, with treatment given in 3, 4, and 5 weeks post tumor inoculation. Study groups included untreated control (
Notes: *represents P < 0.05 compared to control and quercetin oral suspension.
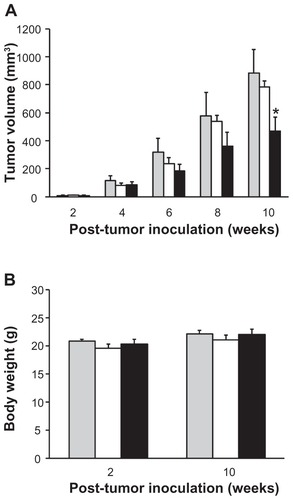
Figure S1 MTT viability of free and nanomicellar quercetin in MDA-MB-231 human breast cancer cell line upon 72 hours of exposure. The concentrations of empty micelle were 96 μM and 192 μM for 30 μM and 60 μM nanomicellar quercetin, respectively.
Notes: Data represent mean ± SEM from three independent experiments. *P < 0.05 as compared to free quercetin group.
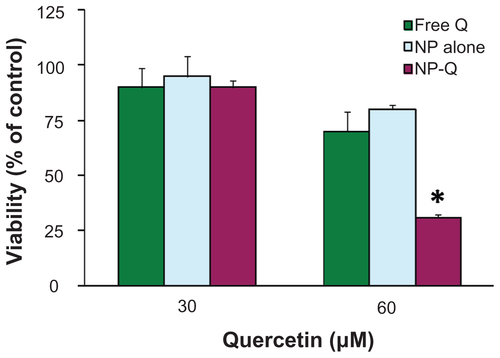
Figure S2 Cellular accumulation of FITC-labeled nanomicelles over 24 hours of incubation under various conditions: (A) at 4°C, (B) at 37°C, (C) without cyclosporine A, (D) with cyclosporine A, (E) without 0.45 M sucrose, (F) with 0.45 M sucrose, (G) without brefeldine A, (H) with brefeldine A.
Notes: Representative images from three independent studies are shown.
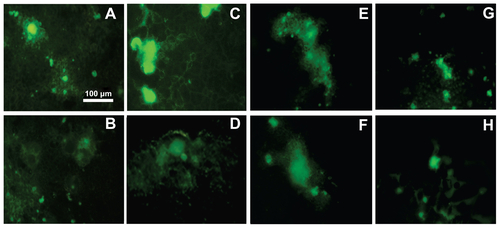
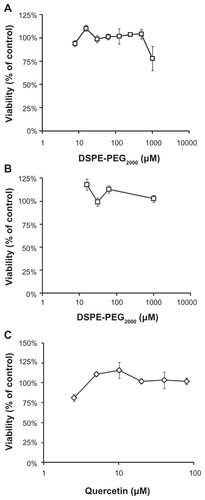
Figure S3 MTT viability of (A) empty, non-drug loaded nanomicelles, (B) quercetin-loaded nanomicelles (showing micelle concentrations), and (C) free quercetin in Caco-2 cell monolayer upon 24 h of exposure.