Figures & data
Figure 1 Characterization of silica nanoparticles. (A) Fourier transform infrared spectroscopy (FT-IR) spectra of mesoporous silica nanoparticles (MSNPs) before removal of hexadecyl trimethyl ammonium bromide (CTAB) template, showing the C–H stretch of the alkyl chains of CTAB at 2750 cm−1. (B) FT-IR of MSNPs after the removal of CTAB template with acidic methanol washing. (C) Scanning electron microscopy image of MSNPs showing the homogeneous shape and diameter. (D) Transmission electron microscopy image of MSNP showing homogeneous displacement of parallel channels. (E) Release of fluorescein-5(6) isothiocyanate-bovine serum albumin from MSNPs. A delay of ~1.5 hours is observed due to the interaction of the bovine serum albumin with the silica scaffold of the nanoparticle.
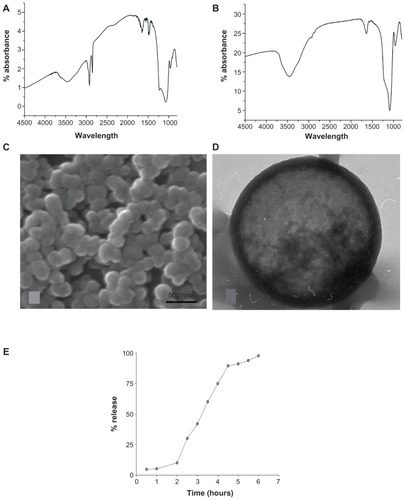
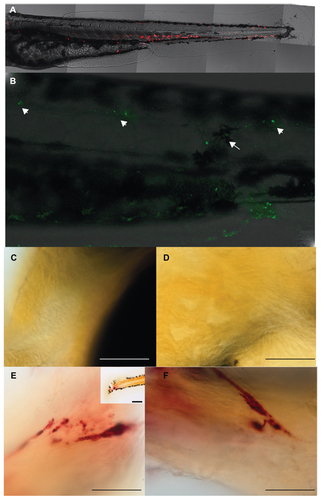
Figure 2 Fluorescent mesoporous silica nanoparticle (MSNP)-injected zebrafish embryos. (A) MSNPs (green) distributed anteriorly and caudally from site of injection (boxed area); the black cells are pigment cells (melanocytes). Scale bar = 100 μm. (B) MSNPs aggregated at the site of injection. Scale bar = 20 μm.
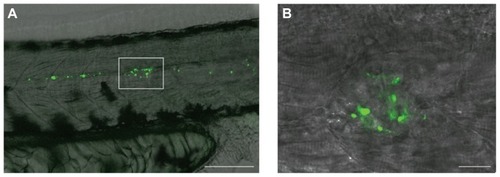
Figure 3 Toxicity of mesoporous silica nanoparticles (MSNPs). (A) Graph showing percentage mortality in zebrafish larvae, larvae affected by pericardial edema, or larvae with normal morphology. The differences between buffer-injected (control) and MSNP-injected (MSNP) embryos are not statistically significant. Bars indicate standard error of mean (n = 168 control and n = 96 for MSNP-injected embryos). The experiment was carried out two times. (B) Embryo injected at 2 days post fertilization (dpf) with MSNPs and fixed and stained at 5 dpf with Alcian blue. It had a combination of abnormalities as follows: pericardial edema, a malformed Meckel’s cartilage (Mc), anterior brachial cartilage (abc) (white arrow), posterior branchial cartilage (pbc) (black arrow), and auditory capsule (aud). Scale bar = 200 μm. (C) Embryo injected at 2 dpf with buffer only, then fixed at 5 dpf and stained with Alcian blue. This embryo shows a normal pharyngeal skeleton. Scale bar = 200 μm. Although we selected this malformed embryo from the MSNP group and the normal from the controls, there was no significant difference in the incidence of malformed embryos between buffer-injected and MSNP-injected groups (n = 25 per group). (D) Quantification of acridine orange-stained cells in control (buffer-injected) and MSNP groups. There was no significant difference after 24 hours of injection between the two groups (ten embryos per group). (E) Acridine orange-stained embryo with dead cells (green) in the eye, heart (h), and nasal placode (np). Scale bar = 100 μm.
Notes: Our result shows no difference between the embryos treated with nanoparticles and controls. P < 0.1, P < 0.01; P < 0.001.
Abbreviation: ov, otic vesicle.
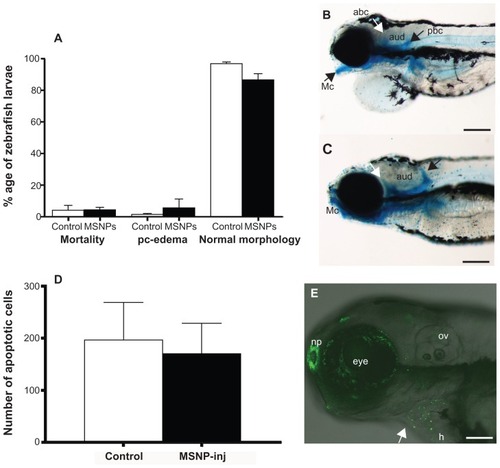
Figure 4 Confocal images showing injection site of lysC::DsRED2 transgenic zebrafish embryos/larvae. (A) Buffer-injected 2 days post fertilization (dpf) embryo 2 hours post injection (overlay of tiles with z stacks). Note the neutrophils (red) at the injection site (arrow) and at more remote sites. (B) An overlay image of a different embryo showing mesoporous silica nanoparticles (MSNPs) (green) and neutrophils (red) at the injection site 2 hours post injection. (C) Representative overlay image of a different embryo injected at 2 dpf with MSNPs and analyzed at 2 hours post injection. This case shows a much smaller accumulation of MSNPs (green) and neutrophils (red) at the injection site than (B). (D) MSNP-injected embryo at 24 hours post injection. MSNPs (green), neutrophils (red). (E) MSNP-injected embryo at 2 dpf. MSNPs (green), neutrophils (red). (F) MSNP-injected embryo at 3 days post injection. MSNPs (green), neutrophils (red). (G) MSNPs (green) in 3 days post injection larva. Leukocytes (blue) detected by L-plastin immunolabeling. (H) Buffer-injected control larva 3 days post injection. Leukocytes (blue) detected by L-plastin immunolabeling. (B–H) Scale bar = 50 μm.
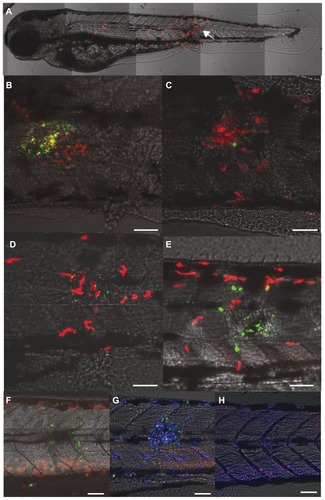
Figure 5 Tartrate-resistant acid phosphatase (TRAcP) enzyme staining in mesoporous silica nanoparticle (MSNP)-injected larvae. (A) TRAcP+ cells at the site of injection in the tail of 3 days post injection larva (arrows). (B) TRAcP+ cells in the head region under the eye (arrows) of a 3 days post injection larva. (C) TRAcP+ cells in the heart region of 3 days post injection larva (arrows). (D) TRAcP+ cells in caudal fin of a 4 days post injection larva. (E) TRAcP+ cells in ventral side of head of 4 days post injection larva (arrows). (F) Phosphate-buffered-saline-injected larva 3 days post injection with no TRAcP+ cells below the eye. Scale bar A, B, C, F = 50 μm; D = 100 μm; and E = 200 μm.
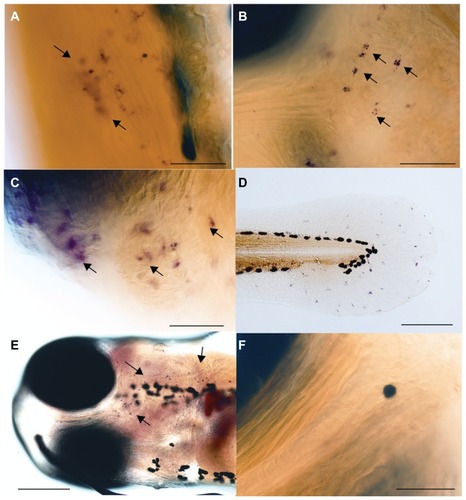
Figure 6 (A) Tartrate-resistant acid phosphatase (TRAcP) expression in the somites of a 3 days post injection larva with apparently multinuclear cell. (B) TRAcP+ cells counterstained with hematoxylin. (C) TRAcP+ zebrafish larva showing apparently multinuclear cells (box). (D) TRAcP enzyme-stained larva counterstained with 4′,6-diamidino-2-phenylindole (DAPI) showing five to six nuclei same area as C (box). Scale bar ABC = 12.5 μm and D = 12 μm. (E) Quantitative analysis of TRAcP+ cells at 2 days post injection (dpi) and 3 dpi. Ten larvae/group were used to quantify the number of TRAcP+ cells. Statistical analysis was done with one-way analysis of variance.
Notes: *P < 0.1; ***P < 0.001. “C” means control (ie, phosphate-buffered-saline injected) and “T” means treated (ie, protein-loaded-MSNP injected).
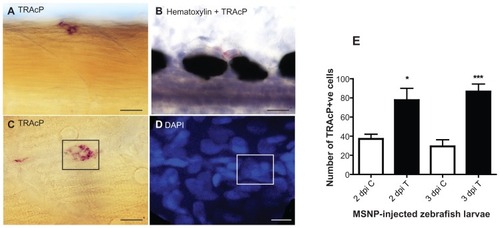
Figure S1 Morphometric analysis of immune cells in lysC::DsRED2 transgenic embryos. (A) Number of neutrophils 2 days post-injection (dpi) of phosphate-buffered saline (PBS) (veh) and mesoporous silica nanoparticles (MSNPs). (B) L-plastin+ leukocytes 2 dpi of PBS (veh) and MSNPs.
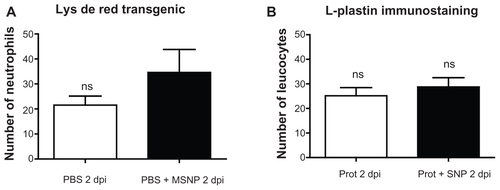
Figure S2 (A) Number of neutrophils 2 and 3 days post injection (dpi) with proteins (prot) or mesoporous silica nanoparticles (prot+MSNP). (B) Number of neutrophils 2 dpi and 3 dpi of phosphate-buffered saline (PBS) and protein. (C) Number of neutrophils 2 dpi and 3 dpi of MSNPs with or without proteins. (D) Number of leukocytes 2 dpi or 3 dpi of MSNP+PBS or proteins+MSNP. (E) Number of leukocytes 2 dpi or 3 dpi of protein or protein+MSNP. (F) Number of total leukocytes 2 dpi or 3 dpi of PBS or protein. Note that the protein means the macrophage colony-stimulating factor and receptor for necrosis factor ligand loaded into the nanoparticles, which in turn are suspended in PBS.
Note: *P < 0.1.
Abbreviation: ns, not significant.
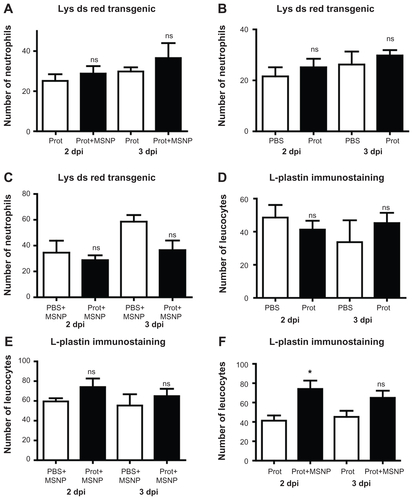
Figure S3 (A) Additional figures showing a control larva without any injection after 24 hours of injection. Neutrophils (red) are normally distributed in the hematopoietic tissue. No cells are found in the tissue of the somites. (B) Embryo showing cell death by acridine orange staining in the posterior region of the body injected with mesoporous silica nanoparticles (MSNPs) after 24 hours of injection. Note here that the arrow shows the MSNPs in the area of injection and arrowheads point toward lateral line organs. (C) Head region of a control larva after tartrate-resistant acid phosphatase (TRAcP) enzyme staining with no TRAcP stained cells. (D) Another view of head region of a control larva after TRAcP enzyme staining with no stained cells. (E) 5 dpf zebrafish larva after cytokine only injection (10 μg/mL M-CSF and 100 μg/mL RANK-L) without using MSNPs. Tartrate-resistant acid phosphatase enzyme staining reveals a highly increased TRAcP expression in the tail region (scale bar = 20 μm); inset shows the posterior region of the same larva at a low magnification (scale bar = 100 μm). (F) Another image of the same embryo (scale bar = 20 μm).
Supplementary movie 1 Two-days post-fertilization zebrafish embryo injected with fluorescent nanoparticles (green) in the left flank behind yolk sac extension showing the movement and distribution of mesoporous silica nanoparticles for the first 2.5 hours after injection. There was an interval of 10 minutes between each frame. Available from: http://youtu.be/mPsLIGAApUg.
Supplementary movie 2 A different, 2-days post-fertilization zebrafish embryo, injected with fluorescent nanoparticles (green) in the left flank behind yolk sac extension showing the movement and distribution of mesoporous silica nanoparticles later than 2.5 hours. The recording was done from 2.5 hours post injection to 5 hours post injection. There was an interval of 10 minutes between each frame. Available from: http://youtu.be/_6sY-110_Oc