Figures & data
Table 1 Physicochemical characteristics of bulk chitosans
Table 2 Size and zeta potential values obtained by dynamic light scattering for chitosan/dsODN-RecQL1 and chitosan/dsODN-ApoB nanoparticles
Figure 1 Environmental scanning electron microscopy images of spherical chitosan/dsODN nanoparticles. (A) 92-10-5 chitosan/dsODN-RecQL1 nanoparticles; (B) 80-40-5 chitosan/dsODN-RecQL1 nanoparticles; (C) 80-10-10 chitosan/dsODN-RecQL1 nanoparticles; (D) 92-10-5 chitosan/dsODN-ApoB nanoparticles; (E) 80-80-5 chitosan/ dsODN-ApoB nanoparticles, and (F) 80-10-10 chitosan/dsODN-ApoB nanoparticles.
Abbreviations: ApoB, apolipoprotein B; dsODN, double-stranded oligodeoxynucleotide.
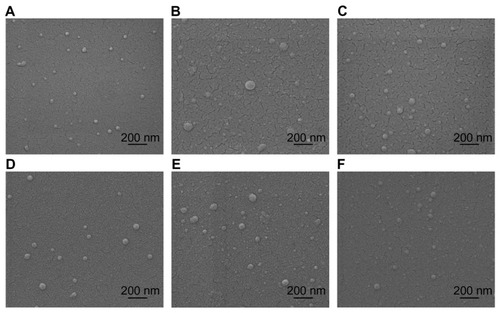
Figure 2 Chitosan nanoparticle temporal stability. Stability was assessed at 0.5, 4, and 24 hours after complex formation using polyacrylamide gel electrophoresis at a pH of 6.5 (MES 1X) and pH8 (TAE 1X). Chitosan 92-10 at different N:P ratios (0.5, 2, and 10) was complexed with: (A) dsODN-RecQL1 at a pH of 6.5; (B) dsODN-RecQL1 at a pH of 8; (C) dsODN-ApoB at a pH of 6.5, and (D) dsODN-ApoB at a pH of 8. Unstable nanoparticles release dsODNs which become visible following EtBr staining on polyacrylamide gel following ethidium bromide staining of the polyacrylamide gel.
Abbreviations: ApoB, apolipoprotein B; dsODN, double-stranded oligodeoxynucleotide; N:P, amine to phosphate.
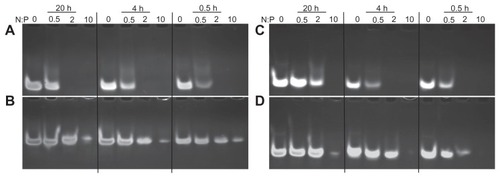
Figure 3 Nuclease protection assays of chitosan/dsODN nanocomplexes. (A) Chitosan (92-10-5, 80-40-5 or 80-10-10) complexed with dsODN-RecQL1. (B) dsODN-RecQL1 remaining after the DNAse I digestion was assessed using the signal intensity of the treated samples with the control (ie, 0 U DNAse I = 100% intensity). This comparison was made between the samples of the same chitosan formulation. (C) Chitosans (92-10-5, 80-80-5 or 80-10-10) complexed with dsODN-ApoB. (D) dsODN-ApoB remaining after the DNAse I digestion was similarly assessed as in (B).
Abbreviations: ApoB, apolipoprotein B; dsODN, double-stranded oligodeoxynucleotide.
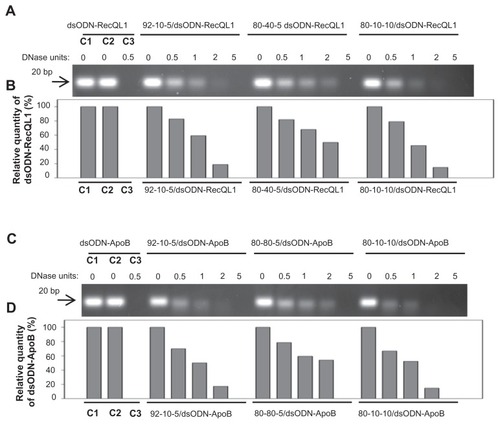
Figure 4 Cellular uptake of dsODN-RecQL1 nanoparticles 24 hours post transfection in AspC1, A549, and LS174T cancer cell lines. Chitosan formulations 92-10-5, 80-40-5, and 80-10-10 were complexed to (6FAM) 5′ labeled dsODN-RecQL1 and transfected at 60 pmol/well 24 hours prior to fluorescence-activated cell sorting analysis. DharmaFECT™ was used as the positive uptake control.
Notes: Values are mean ± SD; n = 3; **P > 0.01.
Abbreviations: dsODN, double-stranded oligodeoxynucleotide; SD, standard deviation.
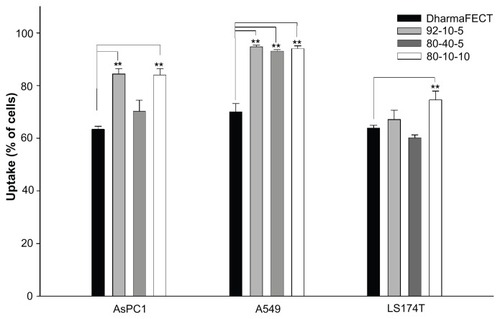
Figure 5 Cellular uptake of dsODN-ApoB nanoparticles 24 hours post transfection in HEK293, Raw269.7, and HepG2 cell lines. Chitosan formulations 92-10-5, 80-80-5, and 80-10-10 were complexed to (6FAM) 5′ labeled dsODN-ApoB and transfected at 60 pmol/well 24 hours prior to fluorescence-activated cell sorting analysis. (A) Uptake efficiency of dsODN-ApoB in percentage (%). (B) Uptake efficiency of dsODN-ApoB in HepG2 cells at different passage numbers. DharmaFECT™ was used as the positive uptake control.
Notes: Values are mean ± SD; n = 3; *P > 0.05; **P > 0.01.
Abbreviations: ApoB, apolipoprotein B; dsODN, double-stranded oligodeoxynucleotide; SD, standard deviation.
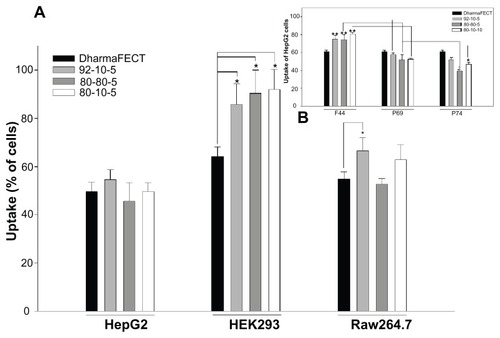
Figure 6 Confocal imaging of chitosan/dsODN nanocomplex uptake 24 hours post transfection. Chitosan 92-10 (DDA, Mn) was labeled with rhodamine (red) and dsODNs were 5′ labeled with (6FAM) (green). Chitosan 92-10 was complexed to dsODNs at an N:P ratio of 5. Cell membranes were stained prior to imaging with CellMask™ (blue) to differentiate between internalized and membrane-bound nanoparticles. Images shown represent each separate channel, with dsODNs in green, chitosan in red, membrane in blue, differential interference contrast image in grey, and the merged images shown on the bottom left quadrant. (A) LS174T cells transfected with chitosan/dsODNRecQL1 nanoparticles. (B) HepG2 cells transfected with chitosan/dsODN-ApoB nanoparticles. (C) HEK293 cells transfected with chitosan/dsODN-ApoB nanoparticles. (D) Raw 294.7 cells transfected with chitosan/dsODN-ApoB nanoparticles.
Abbreviations: ApoB, apolipoprotein B; dsODN, double-stranded oligodeoxynucleotide; N:P, amine to phosphate.
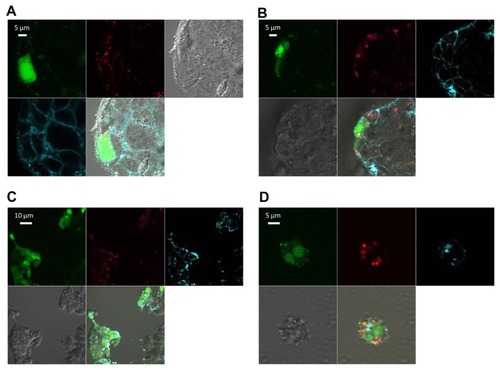
Figure 7 Real-time polymerase chain reaction analysis of the inhibition of RecQL1 and ApoB gene expression in specific cell lines. LS174T cells were transfected with chitosan (92-10-5, 80-40-5, and 80-10-10)/siRNA-RecQL1 nanoparticles, whereas HepG2 cells were transfected with chitosan (92-10-5)/siRNA-ApoB nanoparticles. The inhibition percentage was obtained by comparing the transfected and nontransfected cells, using the ΔΔCT method.
Notes: Values are mean ± SD; n = 3; **P > 0.01.
Abbreviations: ApoB, apolipoprotein B; siRNA, small interfering RNA; SD, standard deviation.
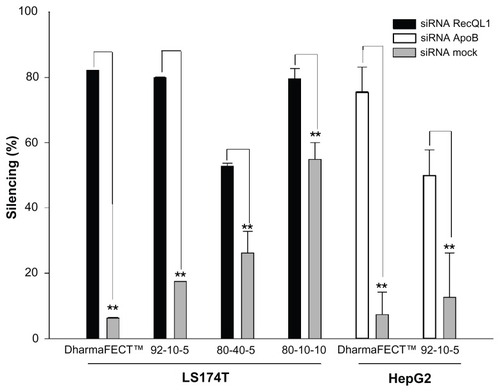
Figure 8 Cell viability assessment using the alamarBlue® assay 24 hours post transfection with different chitosan/siRNA formulations. To alleviate the apoptotic effect of RecQL1 gene silencing for a proper assessment of chitosan-siRNA toxicity, mock siRNA was used for transfection in the LS174T cell line. The HepG2 cell line was transfected with ApoB siRNA. DharmaFECT™ was used for comparison purposes whereas dimethyl sulfoxide was used as a positive control of toxicity.
Notes: Values are presented as mean ± SD; n = 3.
Abbreviations: ApoB, apolipoprotein B; siRNA, small interfering RNA.
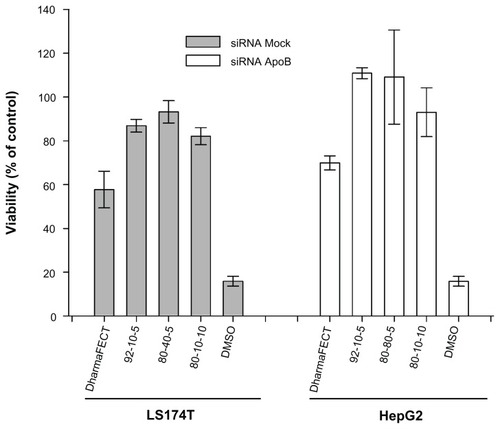
Table 3 Safety and performance criteria for the development of effective nonviral gene delivery systems