Figures & data
Figure 1 The chemical structure of ETO.
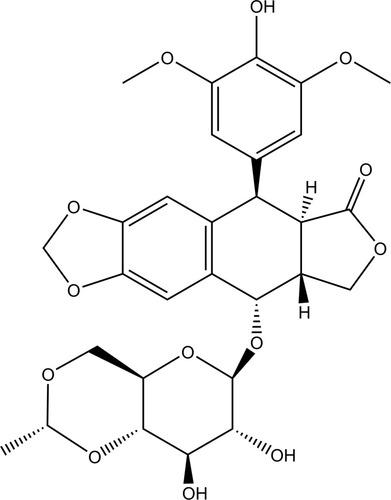
Table 1 Independent Factors and Responses in the Box–Behnken Design
Figure 2 The effect of various parameters, (A) type of organic solvent, (B) ratio of two phases, (C) ultrasonication time, (D) homogenization pressure, (E) type of stabilizer, (F) stabilizer concentration, (G) homogenization cycles in each prescription, on mean PS and PDI of ETO nanopowder.
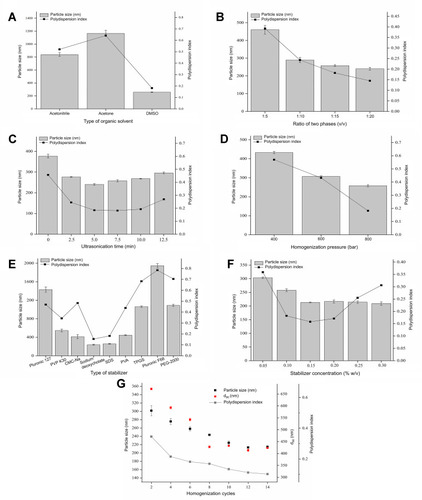
Table 2 Arrangement and Response Variables of Box–Behnken Design
Table 3 Results of Statistical Models for Responses
Table 4 Analysis of Variance (ANOVA) in the Quadratic Model for Responses (Y1 and Y2)
Figure 3 Response surface profiles showed the effects of ultrasonication time (X1), ratio of two phases (X2) and stabilizer concentration (X3) on PS (Y1) and PDI (Y2) of ETO nanopowder. (A) The effect of second-order interaction of ultrasonication time and stabilizer concentration (X1X2) on the PS and PDI of ETO suspension. (B) The effect of second-order interaction of ultrasonication time and stabilizer concentration (X1X3) on the PS and PDI of ETO suspension. (C) The effect of second-order interaction of ultrasonication time and stabilizer concentration (X2X3) on the PS and PDI of ETO suspension.
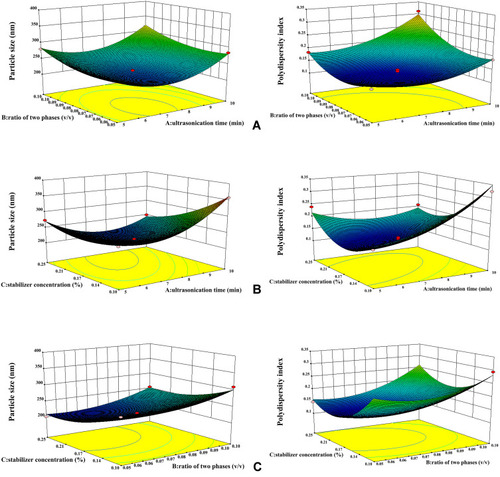
Table 5 Effect of Different Cryoprotectants on Physical Characterization
Figure 4 TEM images of ETO nanopowder. (Scale bar, 200 nm).
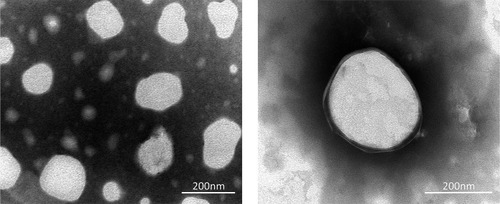
Figure 5 PXRD patterns (A) and DSC thermograms (B) of ETO nanopowder (a); physical mixture of ETO (b); coarse ETO (c); SDS (d); mannitol (e).
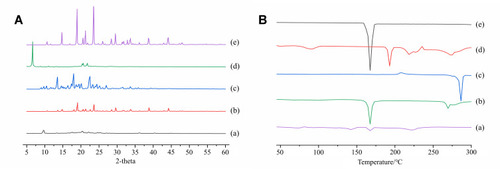
Table 6 Saturation Solubility of the Coarse Powder, Physical Mixture and Nanopowder of ETO in Different Media
Figure 6 Dissolution profile of coarse powder, physical mixture and nanopowder of ETO in pH 1.2 solution (A); pH 6.8 PBS (B) and pH 7.4 PBS (C).
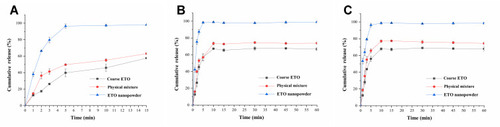
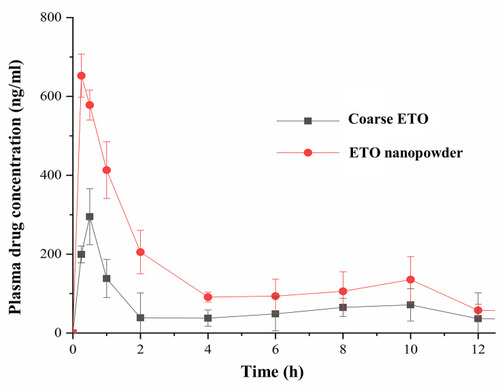
Table 7 Pharmacokinetic Parameters of Oral ETO Coarse Powder and Nanopowder
Figure 7 Plasma concentration-time curves of oral ETO coarse powder and the optimized nanopowder.