Figures & data
Figure 1A Ultraviolet-visible spectroscopic analysis of aqueous extract of the medicinal plant Cassia fistula.
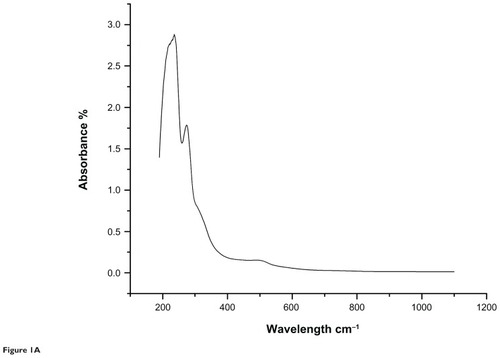
Figure 1B Ultraviolet-visible spectroscopic analysis of gold nanoparticles from the medicinal plant Cassia fistula.
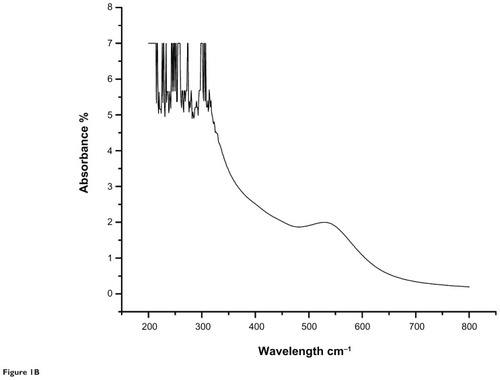
Figure 2A Characteristic Fourier transform infrared absorption spectra for aqueous extract of Cassia fistula.
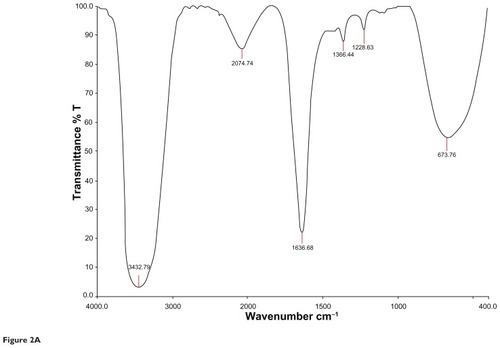
Figure 2B Characteristic Fourier transform infrared absorption spectra for Cassia fistula after bioreduction of gold ions to gold nanoparticles. 30 days, blood sugar levels were 211.05 ± 5.40 mg/dL and 168.47 ± 16.18 mg/dL, respectively. Rats that also received insulin showed a decrease in blood sugar levels. In the diabetic control rats, blood sugar levels reached a peak by the end of the experimental period.
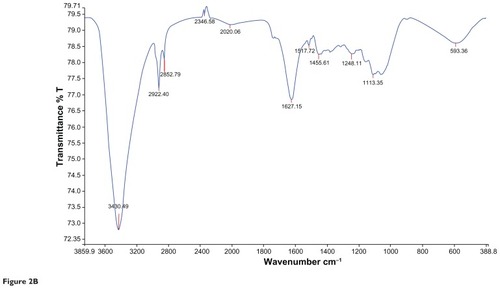
Figure 3 Scanning electron microscopic images of phytochemically synthesized gold nanoparticles. (A) and (B) Formation of gold nanoparticles by reduction of gold ions. (C) Different shapes of particles formed (16,000×) and (D) nanometer size of gold nanoparticles (23,000×).
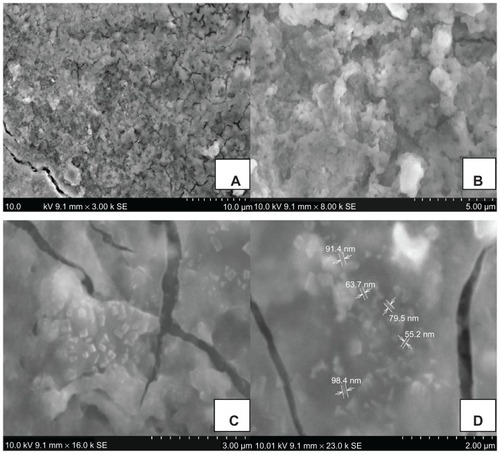
Figure 4 Effect of aqueous and gold nanoparticles on body weight of normal, nondiabetic, and diabetic male albino Wistar rats. Each value represents the mean ± standard error of the mean (n = 5). The values were found to be statistically significant at P < 0.05.
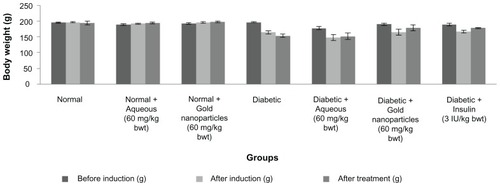
Figure 5 Serum glucose levels in normal, diabetic and diabetic treated male albino Wistar rats after 30 days of treatment. Each value represents the mean ± standard error of the mean (n = 5).
Note: The values were found to be statistically significant at P < 0.05.
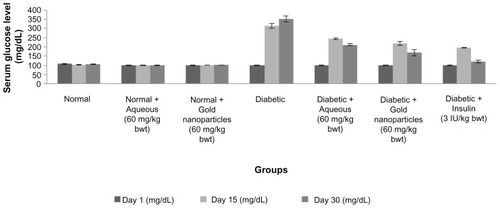
Figure 6 Percentage of total hemoglobin after 30 days of treatment with aqueous extract or gold nanoparticles from Cassia fistula in controls and rats with streptozotocin-induced diabetes.
Notes: Each value represents the mean ± standard error of the mean (n = 5). The values were found to be statistically significant at P < 0.05.
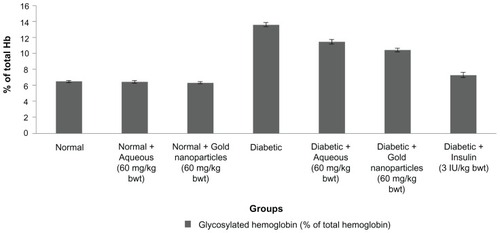
Figure 7 Total liver concentration of normal, diabetic and diabetic treated rats after 30 days of treatment.
Notes: Each value represents the mean ± standard error of the mean (n = 5). The values were found to be statistically significant at P < 0.05.
Abbreviations: ALP, alkaline phosphatase; ALT, alanine transaminase; AST, aspartate transaminase.
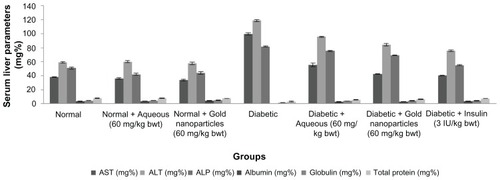
Figure 8 Serum urea, creatinine and uric acid levels of aqueous and gold nanoparticles of C. fistula on different groups of male albino Wistar rats.
Notes: Each value represents the mean ± standard error of the mean (n = 5). The values were found to be statistically significant at P < 0.05.
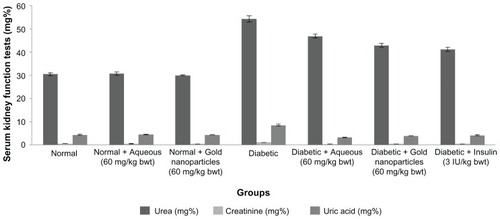
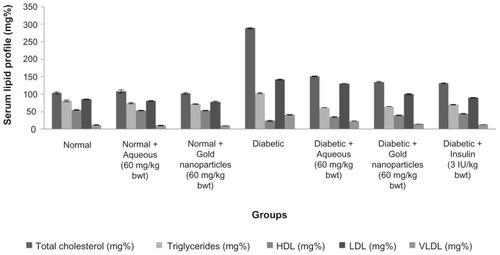
Figure 9 Lipid profile of experimental animals after 30 days of treatment with aqueous extract or gold nanoparticles from Cassia fistula.
Notes: Each value represents the mean ± standard error of the mean (n = 5). The values were found to be statistically significant at P < 0.05.
Abbreviations: HDL, high-density lipoprotein; LDL, low-density lipoprotein; VLDL, very low-density lipoprotein.