Figures & data
Figure 1 Morphology of nanofibrous PLGA scaffolds enriched with nanodiamond. (A) Gross morphology of a composite PLGA-nanodiamond membrane deposited on polypropylene fabric. An arrow indicates a site where a part of the membrane was detached. (B) A composite PLGA-nanodiamond membrane fixed with a Scaffdex CellCrown insert. (B’, Scaffdex CellCrown insert with a PLGA-nanodiamond membrane in a 24-well plate, arrow). (C) Pure PLGA nanofibrous membrane. (D) Composite PLGA-nanodiamond membrane. (A and B) Nikon Coolpix S620 digital camera and (C and D) XL30CP scanning electron microscope (Phillips Elektron Optics GmbH, Kassel, Germany), objective magnification 2000×, bar 10 μm.
Abbreviation: PLGA, copolymer of L-lactide and glycolide.
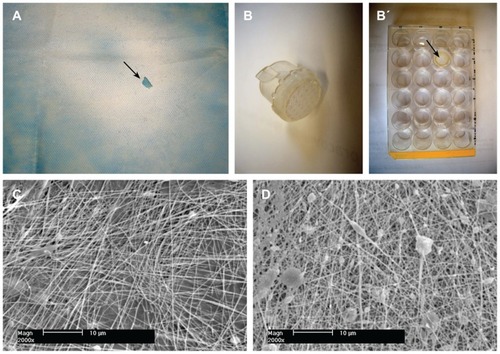
Table 1 Morphological parameters of pure poly(lactide-coglycolide) (PLGA) membranes and PLGA membranes with nanodiamond (PLGA-ND)
Figure 2 Transmission electron microscopy images of pure PLGA fibers (A) and PLGA fibers with diamond nanoparticles (B–D). (B) Network of PLGA with diamond nanoparticles, showing variations in fiber thickness and size of the material clusters. (C) Individual fibers with clusters of diamond nanoparticles. (D) Diamond nanoparticles relatively homogeneously distributed in a PLGA fiber.
Notes: The layers with elliptical openings (A–C) are amorphous carbon membranes of the grid used to fix the sample. A Philips CM120 transmission electron microscope, LaB6 cathode operated at 120 kV, and SIS Veleta CCD camera, were used. Scale bar 1 μm (A), 2 μm (B), and 200 nm (C and D).
Abbreviation: PLGA, copolymer of L-lactide and glycolide.
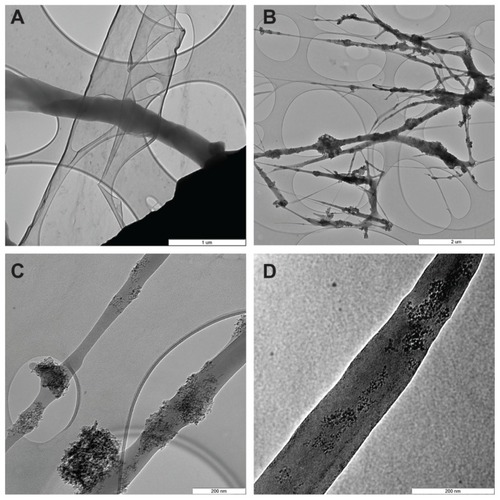
Table 2 Tensile strength of poly(lactide-co-glycolide) (PLGA) and PLGA membranes with nanodiamond (PLGA-ND) membranes
Figure 3 Load at rupture (A) and deflection of probe at rupture (B) of nanofiber membranes consisting of pure PLGA and PLGA-ND.
Notes: The mean ± standard error of the mean are presented for 10 samples from each experimental group. Two-tailed t-test, P ≤ 0.001 in comparison with PLGA.
Abbreviations: PLGA, copolymer of L-lactide and glycolide; ND, nanodiamond.
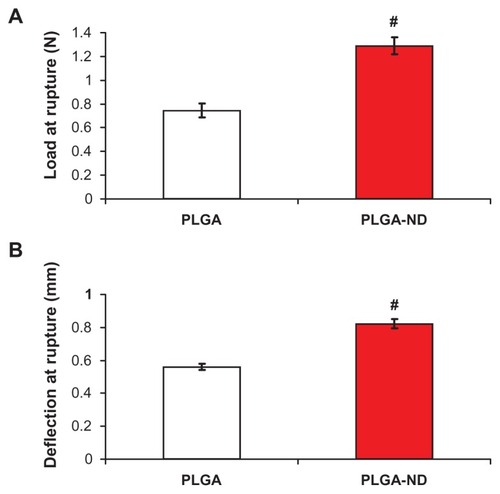
Figure 4 Fourier transform infrared spectra of nanofiber membranes consisting of pure PLGA and PLGA-ND.
Abbreviations: PLGA, copolymer of L-lactide and glycolide; ND, nanodiamond.
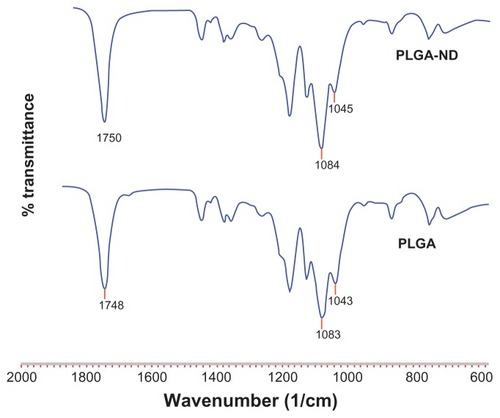
Figure 5 (A) Number of human osteoblast-like MG-63 cells on days 1, 3, and 7 after seeding on a pure nanofibrous PLGA membrane, a PLGA-ND membrane, and bottom of polystyrene culture wells. (B) Size of cell spreading area on day 1 after seeding. (C) Growth dynamics of cells on substrates from days 1–7. (D) Viability of MG-63 cells on days 1, 3 and 7 after seeding on the substrates. Mean ± standard error of the mean of three experiments. In total, 72 measurements of cell numbers (A, C) and 20 measurements of cell viability (D) were performed, and 200–278 cell spreading areas (B) were evaluated for each experimental group and time interval.
Notes: Analysis of variance, Student-Newman-Keuls method. *,#P ≤ 0.05 in comparison with polystyrene and PLGA, respectively.Citation1,Citation3 P ≤ 0.05 in comparison with cells on days 1 and 3 after seeding on corresponding substrate.
Abbreviations: PLGA, copolymer of L-lactide and glycolide; ND, nanodiamond; PS, polystyrene.
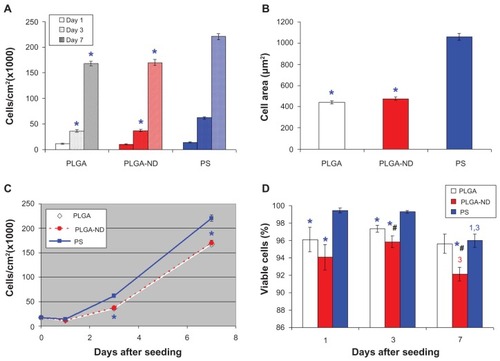
Table 3 Cell population doubling time (DT) of MG 63 cells on poly(lactide-co-glycolide) (PLGA) membranes with and without nanodiamond (ND), and tissue culture polystyrene dishes (PS) as a reference material
Figure 6 Morphology of human osteoblast-like MG-63 cells on days 1 (A–C), 3 (D–F), and 7 (G–I) after seeding on pure PLGA scaffolds (A, D, and G), composite PLGA-ND scaffolds (B, E, and H), and a polystyrene culture well (C, F, and I). The cell membrane and cytoplasm were stained with Texas Red C2-maleimide (red fluorescence), and the cell nuclei with Hoechst 33342 (blue fluorescence).
Notes: A Nikon Eclipse Ti-E microscope, objective 20 × 1.5; Nikon DS-Qi1 MC digital camera, NIS-Elements AR software, version 3.10, were used. Summarization of Z-sections with deconvolution, bar 50 μm.
Abbreviations: PLGA, copolymer of L-lactide and glycolide; ND, nanodiamond.
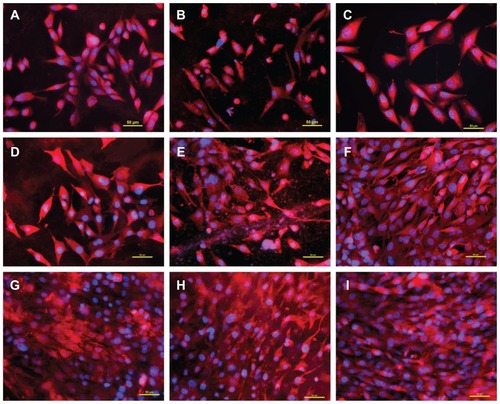
Figure 7 Live (green) and dead (red) human osteoblast-like MG-63 cells on days 1 (A–C), 3 (D–F), and 7 (G–I) after seeding on pure PLGA scaffolds (A, D, and G), composite PLGA-ND scaffolds (B, E, and H) and a polystyrene culture well (C, F, and I).
Notes: Stained with the LIVE/DEAD viability/cytotoxicity kit for mammalian cells. Olympus IX-51, objective 20×, DP-70 digital camera, bar 200 μm.
Abbreviations: PLGA, copolymer of L-lactide and glycolide; ND, nanodiamond.
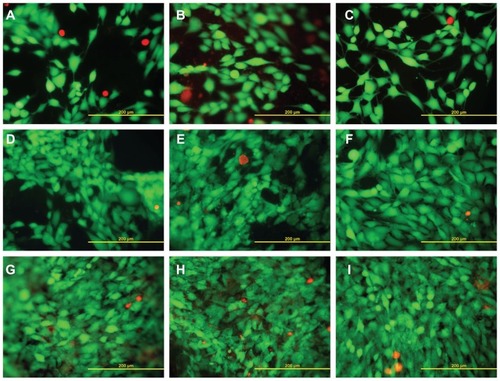
Figure 8 Immunofluorescence of talin (A–C), vinculin (D–F), and beta-actin (G–I) in human osteoblast-like MG-63 cells on day 3 after seeding on pure PLGA scaffolds (A, D, and G), composite PLGA-ND scaffolds (B, E, and H), and polystyrene culture well (C, F, and I).
Notes: Leica confocal laser scanning microscope (TCS SP2, Germany), objective 20×, zoom 8× (A) 8.5× (B), or 6× (remainder of pictures); bar 25 μm.
Abbreviations: PLGA, copolymer of L-lactide and glycolide; ND, nanodiamond.
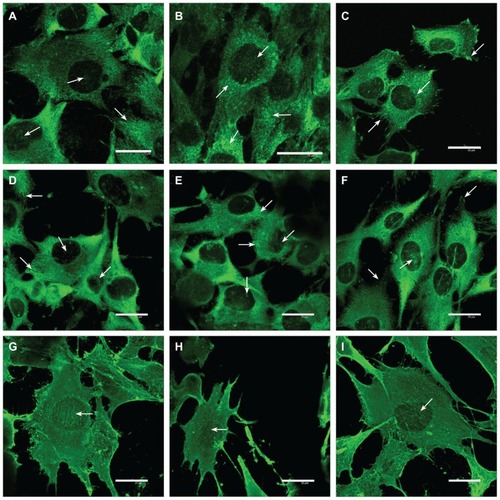
Figure 9 Markers of cell immune activation in human osteoblast-like MG-63 cells (A–I) and murine macrophage-like RAW 264.7 cells (B–J) on day 7 after seeding on pure nanofibrous PLGA membranes, PLGA membranes with ND, PLGA membranes with HAp, and bottom of polystyrene culture wells with and without CellCrown inserts (PS-CC and PS, respectively). (A and B) Cell number, with which the markers were correlated. (C and D) Concentration of TNF-α in the cell culture media taken from MG-63 or RAW 264.7 cells cultured on the tested materials. (E and F) Calibration curves for TNF-α measured by human and mouse TNF-α Quantikine enzyme-linked immunosorbent assay kits, respectively. (G and H) Concentration of TNF-α in culture media taken from MG-63 or RAW 264.7 cells after 24-hours of stimulation with bacterial lipopolysaccharide (0–10 μg/mL). (I and J) Concentration of ICAM-1 (per mg of protein) in homogenates of MG-63 or RAW 264.7 cells grown on the tested materials. Mean ± standard error of the mean for four samples from each experimental group. In total, for each experimental group, 72 (A and B), eight (C, D, G, and H) or 24–26 (I and J) measurements were performed. Analysis of variance, Student-Newman-Keuls method. The numbers above the columns indicate the type of tested sample (A–D) or lipopolysaccharide concentration (G and H) with significantly different values.
Note: P ≤ 0.05.
Abbreviations: PLGA, copolymer of L-lactide and glycolide; ND, nanodiamond; HAp, hydroxyapatite; PS, polystyrene; ICAM-1, intracellular adhesion molecule-1; LPS, lipopolysaccharide; TNF-α, tumor necrosis factor alpha.
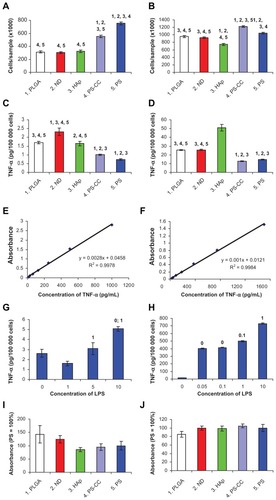
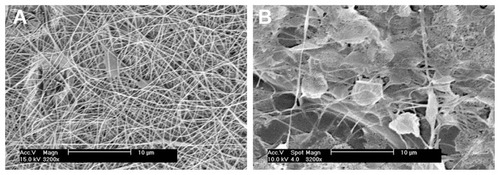
Figure 10 Morphology of nanofibrous PLGA scaffolds created by electrospinning of PLGA diluted in methylene chloride and dimethyl formamide (2:3) at a concentration of 2.3 wt% (A) or 2.0 wt% (B).
Note: XL30CP scanning electron microscope (Phillips Elektron Optics GmbH, Kassel, Germany), objective magnification 3200×, bar 10 μm.
Abbreviation: PLGA, copolymer of L-lactide and glycolide.