Figures & data
Table 1 Characterization of silica, polystyrene, and gold nanoparticles
Figure 1 Helium scanning micrographs of (A) 10-nm silica nanoparticles, (B) 50-nm silica nanoparticles, and (C) 60-nm polystyrene nanoparticles and transmission electron micrographs of (D) 18-nm gold nanoparticles.
Abbreviations: Au NPs, gold nanoparticles; PS NPs, polystyrene nanoparticles; SiO2 NPs, silica nanoparticles.
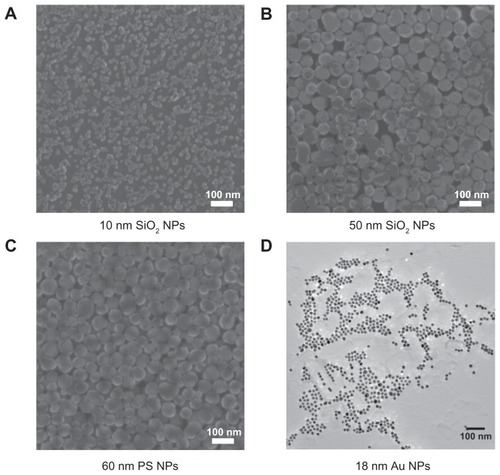
Figure 2 Effects of silica nanoparticles on platelet aggregation using quartz crystal microbalance with dissipation. Perfusion of fibrinogen-coated polystyrene-coated quartz crystals with platelet-rich plasma in the presence of silica nanoparticles leads to platelet aggregation. (A) Representative traces from the third overtone recorded by the device showing the effects of platelet-rich plasma in the presence or absence of silica nanoparticles on frequency (blue line, left axis) and dissipation (red line, right axis). (B) Representative micrographs of the surface of fibrinogen-coated polystyrene-coated quartz crystals as viewed by phase contrast microscopy showing increased accumulation of platelet aggregates following perfusion of platelet-rich plasma in the presence of silica nanoparticles.
Abbreviations: min, minutes; PRP, plasma-rich protein; sec, seconds.
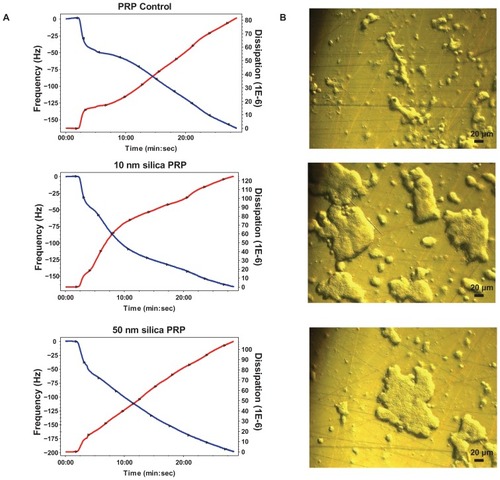
Figure 3 Quantitative analysis of the effects of silica nanoparticles on frequency and energy dissipation (from the third overtone), where the maximal changes in frequency (negative shift) and dissipation (positive shift) for the control are considered as 100%. (A) Incubation of platelets with 50-nm silica nanoparticles at concentrations up to 200 μg mL−1 significantly induced changes in frequency and dissipation. (B) Incubation of platelets with 10-nm silica nanoparticles (100 μg mL−1) significantly induced changes in dissipation.
Notes: Data are expressed as mean ± standard deviation. *P < 0.05; **P < 0.01; ***P < 0.001.
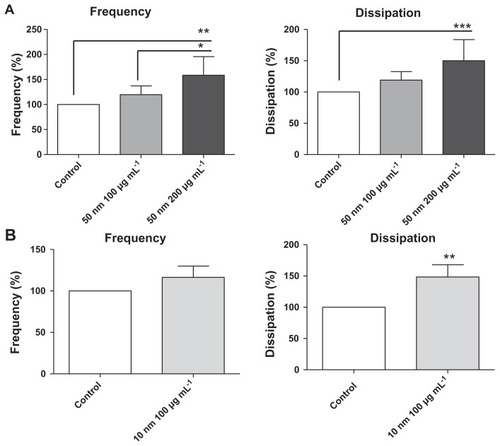
Figure 4 Representative micrographs of the surface of fibrinogen-coated polystyrene-coated quartz crystals as viewed by helium ion microscopy after the perfusion of platelet-rich plasma (A) and platelet-rich plasma in the presence of 10-nm silica nanoparticles (B) and 50-nm silica nanoparticles (C). Increased accumulation of platelet aggregates and bigger aggregates induced by the perfusion of platelet-rich plasma in the presence of silica nanoparticles is shown.
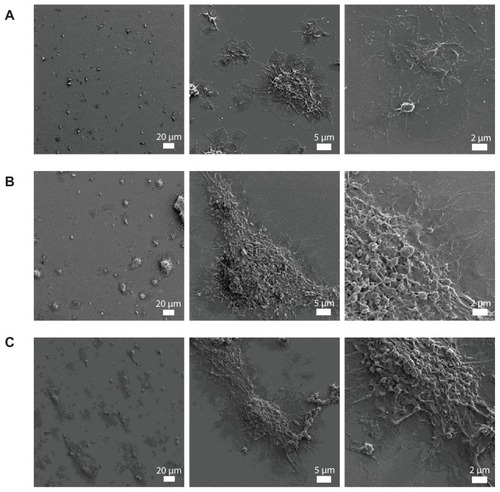
Figure 5 Effects of polystyrene nanoparticles on platelet aggregation using quartz crystal microbalance with dissipation. Perfusion of fibrinogen-coated polystyrene-coated quartz crystals with platelet-rich plasma in the presence of polystyrene nanoparticles leads to platelet aggregation. (A) Representative traces from the third overtone recorded by the device showing the effects of platelet-rich plasma in the presence or absence of polystyrene nanoparticles on frequency (blue line, left axis) and dissipation (red line, right axis). (B) Quantitative analysis of the effects of polystyrene nanoparticles on frequency and dissipation. Incubation of platelets with 60-nm polystyrene nanoparticles at concentrations up to 200 μg mL−1 significantly induced changes in frequency and dissipation.
Notes: Data are expressed as mean ± standard deviation. *P < 0.05.
Abbreviations: min, minutes; PRP, plasma-rich protein; sec, seconds.
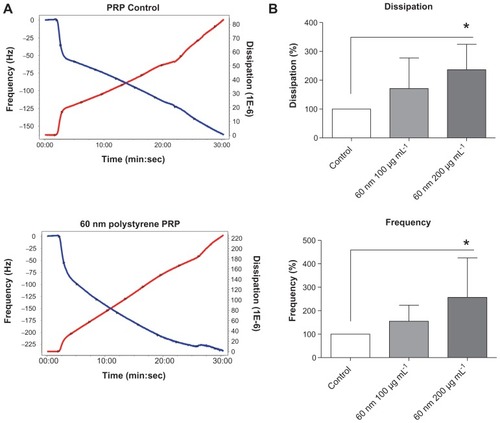
Figure 6 Effects of gold nanoparticles on platelet aggregation using quartz crystal microbalance with dissipation. Perfusion of fibrinogen-coated polystyrene-coated quartz crystals with platelet-rich plasma in the presence of gold nanoparticles leads to platelet aggregation. (A) Representative traces from the third overtone recorded by the device showing the effects of platelet-rich plasma in the presence or absence of gold nanoparticles on frequency (blue line, left axis) and dissipation (red line, right axis). (B) Quantitative analysis of the effects of gold nanoparticles on frequency and dissipation.
Notes: Data are expressed as mean ± standard deviation. *P < 0.05.
Abbreviations: min, minutes; PRP, plasma-rich protein; sec, seconds.
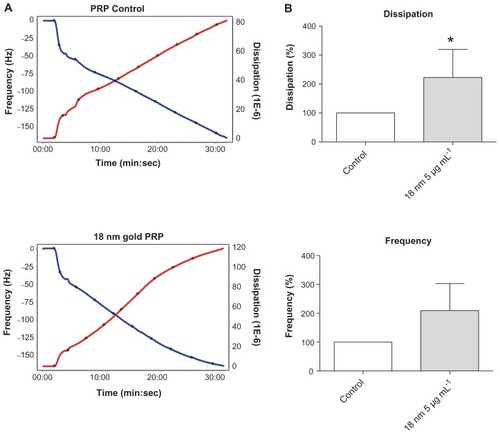
Figure 7 Effects of silica, polystyrene, and gold nanoparticles on platelet-poor plasma using quartz crystal microbalance with dissipation. Perfusion of fibrinogen-coated polystyrene-coated quartz crystals with platelet-poor plasma in the presence of silica, polystyrene, and gold nanoparticles did not induce significant changes in frequency and dissipation. Representative traces from the third overtone recorded by the device showing the effects of platelet-poor plasma in the presence or absence of (A) silica nanoparticles, (B) polystyrene nanoparticles, and (C) gold nanoparticles on frequency (blue line, left axis) and dissipation (red line, right axis).
Abbreviation: min, minutes; PPP, platelet-poor plasma; sec, seconds.
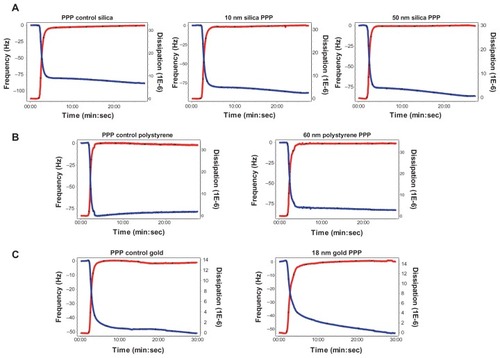
Figure 8 Effects of silica, polystyrene, and gold nanoparticles on platelet aggregation using light aggregometer. (A) Representative traces from aggregometry studies in platelet-rich plasma in the presence or absence of 10-nm silica nanoparticles. Collagen (blue line) was used as a positive control; stirring platelets in the absence of nanoparticles (black line) were used as negative control. Only 200 μg mL−1 (green line) induced significant platelet aggregation. Quantitative analysis of (B) 10-nm silica nanoparticles with all concentrations tested, (C) 50-nm silica nanoparticles with all concentrations tested, (D) 60-nm polystyrene nanoparticles with all concentrations tested, and (E) gold nanoparticles.
Notes: Data expressed as mean ± standard deviation. ***P < 0.001 versus stirring.
Abbreviations: Au, gold; min, minutes; PS, polystyrene; sec, seconds; SiO2, silica.
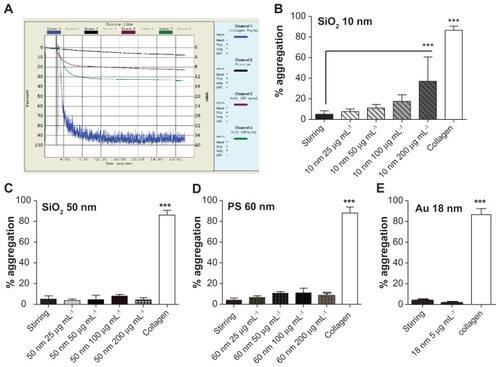
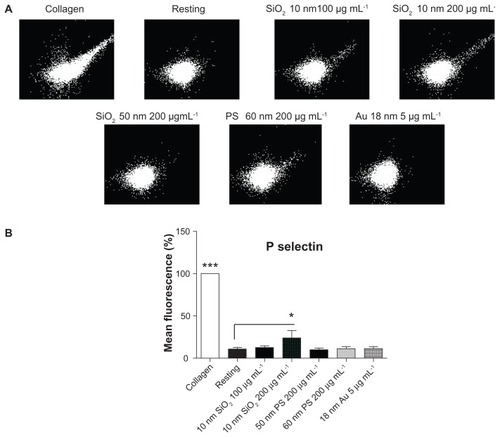
Figure 9 Effects of silica, polystyrene, and gold nanoparticles on platelet receptors. (A) Representative flow cytometry recordings showing analysis of P-selectin on platelets in the presence and absence (resting) of 10-nm and 50-nm silica and polystyrene nanoparticles (up to 200 μg mL−1) and 18-nm gold nanoparticles (5 μg mL−1). Collagen (5 μg mL−1) was used as positive control. (B) Quantitative analysis of the effects of silica, polystyrene, and gold nanoparticles on P-selectin.
Notes: Data expressed as mean ± standard deviation. *P < 0.05; ***P < 0.001 versus resting.
Abbreviations: Au, gold; PS, polystyrene; SiO2, silica.