Figures & data
Table 1 SLN, Liposomes and PLGA NPs Stability According to Their Size, Polydispersity Index and Zeta Potential. Results are Presented as Mean ± SD (n=3)
Figure 1 Morphological characterization of NPs by transmission electron microscopy: liposomes (A), PLGA NPs (B) and SLN NPs (C). Samples were diluted at a ratio of 1:100. Scale bar corresponds to 200 nm.
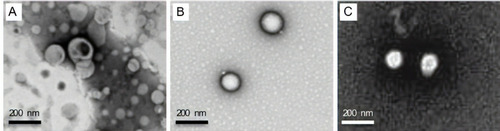
Figure 2 (A) Experimental time-points associated with NPs injections and BW evaluation, as well as the organs collection. (B) Identification of the collected organs that were subsequently analyzed to test the presence and distribution of NPs and/or histopathological lesions.
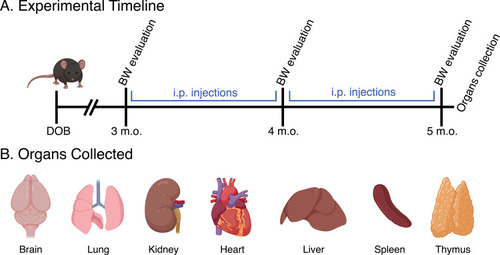
Figure 3 (A) Bodyweight variation over experiment duration (x-axis). The y-axis represents the weight change of male animals in relation to the first day of NPs administration. (B) Bodyweight variation over experiment duration (x-axis). The y-axis represents the weight change of female animals in relation to the first day of NPs administration. Data are expressed as mean ± SEM (n = 3–4; *p < 0.05 when comparing SLN group to PLGA-treated animals; **p <0.01, when comparing SLN group to CTR and liposomes-treated animals; one-way ANOVA with Holm-Sidak’s post-test).
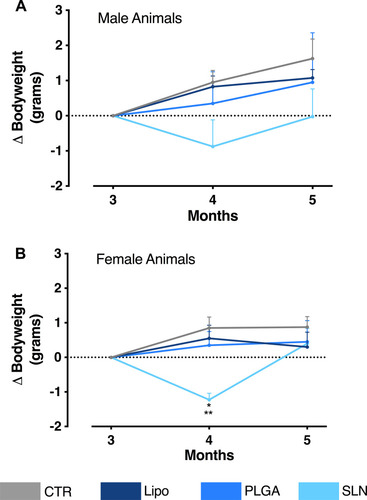
Figure 4 NPs distribution in liver, spleen and bone marrow of NPs-injected mice. Score of NPs presence and distribution in liver (A), spleen (B) and bone marrow (C) of experimental animals. Pathology score for NPs density followed a 5-tier severity scale: 0, absent; 1, minimal; 2, mild; 3, moderate; 4, marked. Data is represented as mean ± SEM (n=3-4; *** p < 0.001, **** p < 0.0001; one-way ANOVA followed by Holm-Sidak’s post-test).
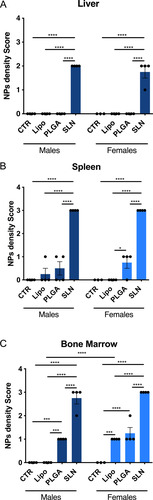
Figure 5 Histopathology images under polarized light of liver, spleen and bone marrow of CTR and NPs-injected male and female animals. NPs were not detected in organs or in control mice. Original magnification, 20x (for liver and spleen) and 40x (bone marrow). White arrows point to nanoparticles accumulated in the tissue.
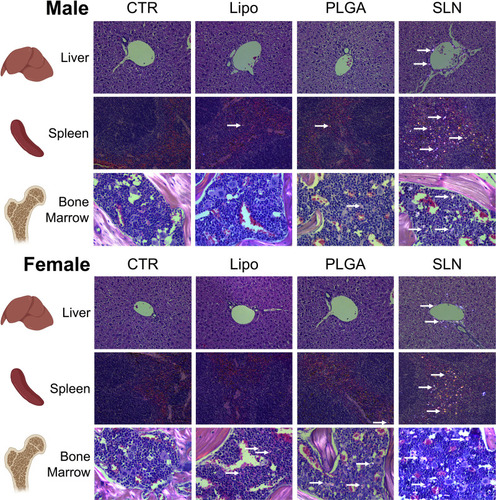
Figure 6 Identification of lesions presence and severity in liver (A), kidney (B) and lung (C) of experimental animals. No statistical differences between groups were obtained. No statistical differences between groups were obtained. Pathology score for lesions presence followed a 5-tier severity scale: 0, absent; 1, minimal; 2, mild; 3, moderate; 4, marked. Data is represented as mean ± SEM (n=3-4; non-significant; one-way ANOVA followed by Holm-Sidak’s post-test). Complete description for histopathological findings is showed in Supplementary .
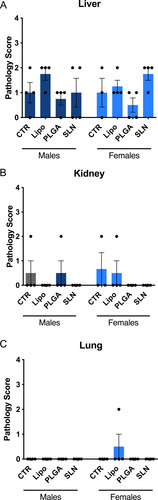
Figure 7 Representative microphotographs from male animals of H&E-stained sections of brain, kidney, heart, liver, spleen, thymus and lung. Original magnification, 20x.
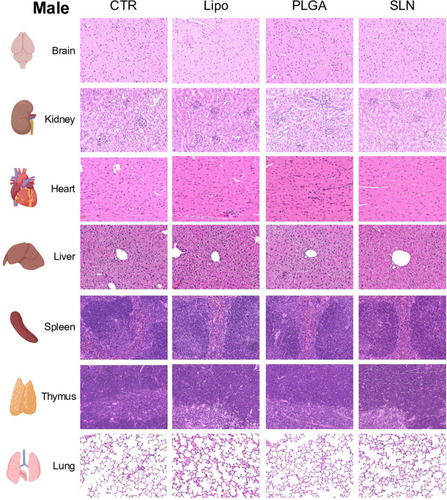
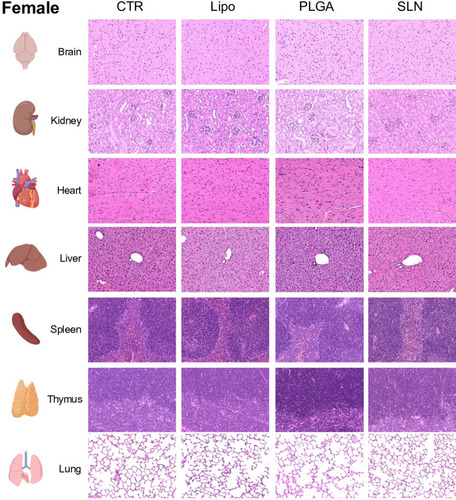
Figure 8 Representative microphotographs from female animals of H&E-stained sections of brain, kidney, heart, liver, spleen, thymus and lung. Original magnification, 20x.