Figures & data
Table 1 Nanoparticle Formulations with the Hydrating Medium Volume of 10 mL
Figure 1 Absorption spectra of (A) DMA-NP, (B) DMA-IR-NP, (C) Absorbance ratio of DMA-IR-NP to DMA-NP at the peak wavelengths of 380 and 402 nm, (D) Fluorescence spectra of DMA-IR-NP setting the excitation wavelength at 375 nm, (E) Fluorescence intensity ratio of DMA-IR-NP to DMA-NP at the peak emission wavelength of 429 nm after being exposed to 830-nm NIR at 0.0118 W/cm2 at different time points, and (F) Explanatory illustration of the scenario implied by (C, E).
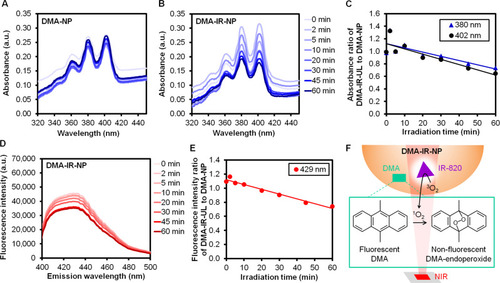
Figure 2 Negative-stained TEM images of (A) NP, (B) PEm-NP, (C) PEm-IR-NP, (D) corresponding intensity-weighted hydrodynamic size distribution, (E) correlograms, and (F) absorption spectra. The scale bars are displayed on each image.
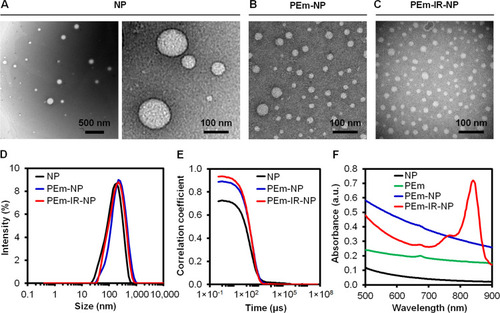
Figure 3 (A) Negative-stained TEM images of PEm-IR-NP irradiated at different fluences of 830-nm NIR, (B) A schematic illustration representing the consequences on PEm-IR-NP corresponding to the NIR fluence, and (C) The increases in the lipid hydroperoxides in PEm-IR-NP (phospholipids concentration = 4 mg/mL) irradiated with various fluences of 830-nm NIR when normalized with the concentration of the lipid hydroperoxides in PEm-IR-NP before irradiation. Different letters above the box plots indicate the statistically significant differences (P < 0.001) and n = 8. Scale bar = 100 nm.
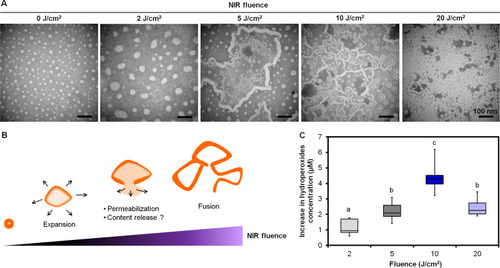
Figure 4 The release profile of the TPC from PEm-IR-NP into the stirred simulated sweat solution (pH 5.4) maintained at 32°C with and without 830-nm irradiation at 0.0118 W/cm2 for the first 30 minutes.
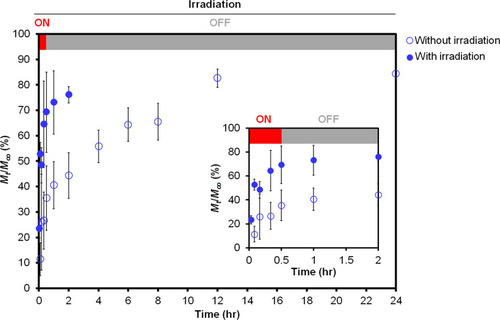
Table 2 Characterization of the Release Profile Curves of TPCs from PEm-IR-NP into the Stirred Simulated Sweat Solution (pH 5.4) Maintained at 32°C with and without 830-nm Irradiation at 0.0118 W/cm2 for the First 30 Minutes
Figure 5 Cell viability of the HaCaT cells after being treated with various nanoparticle formulations and positive controls including clobetasol propionate as well as phenol solutions with and without 830-nm irradiation at 20 J/cm2 (n = 4).
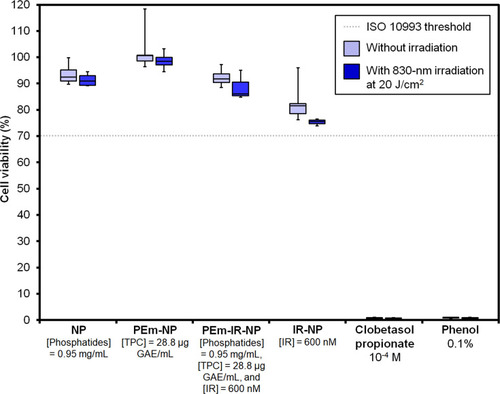
Figure 6 TEM images of (A) TRITC-Dex40-IR-NP, (B) TRITC-Dex40, (C) Intensity-weighted hydrodynamic size distribution, (D) Correlograms of TRITC-Dex40-IR-NP before and after SEC, and (E) Absorption spectra of NP, TRITC-Dex40-NP, and TRITC-Dex40-IR-NP. SEC f1 and SEC f2 are the first and second fractions eluted from SEC, respectively. The scale bars are displayed on each image.
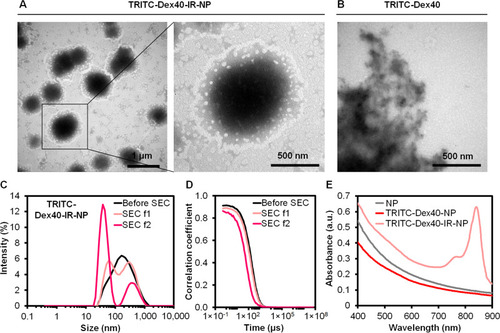
Figure 7 (A) Bright-field and fluorescent images of the HaCaT cells at 0, 2, and 6 hours post treatment with free TRITC-Dex40, TRITC-Dex40-NP, or TRITC-Dex40-IR-NP maintaining the concentration of TRITC-Dex40 at 9.4 μg/mL or IR-820 at 600 nM, and (B) Relative fold change in the fluorescence intensity of TRITC-Dex40 in the lysate extracted from the treated HaCaT cells. Different letters above the box plots indicate the statistically significant differences (P < 0.05) and n = 5. Scale bar = 100 µm.
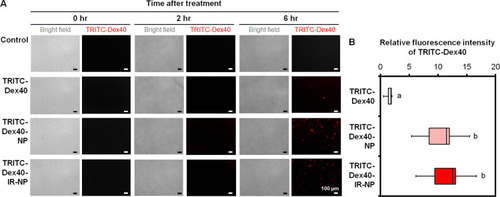
Figure 8 (A) Timeline of the experiments for monitoring endolysosomal escape and deconvoluted confocal microscopy images of the HaCaT keratinocytes at 0, 2, and 4 hours post 6-hour treatment with (B, C) TRITC-Dex40-NP and (D, E) TRITC-Dex40-IR-NP (B, D) without and (C, E) with 830-nm irradiation at fluence of 20 J/cm2. Scale bar = 10 µm.
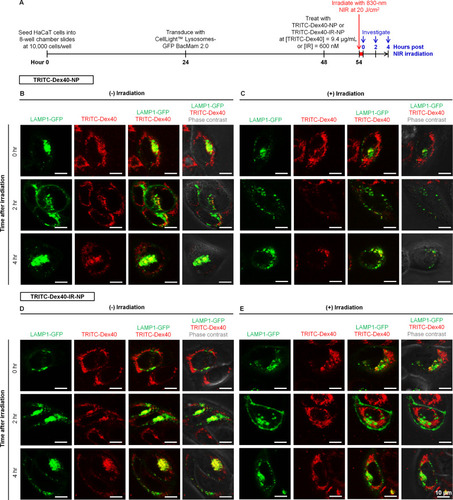
Figure 9 (A) Van Steensel CCFs, (B) ICQ, and (C) TOSh ratios (irradiated to non-irradiated conditions) of the fluorescent images acquired from the CellLightTM-lysosome-GFP-transfected HaCaT cells at 0, 2, and 4 hours post-treatment with TRITC-Dex40-IR-NP or TRITC-Dex40-NP for six hours before 830-nm irradiation at a fluence of 20 J/cm2. n = 4 for (B, C).
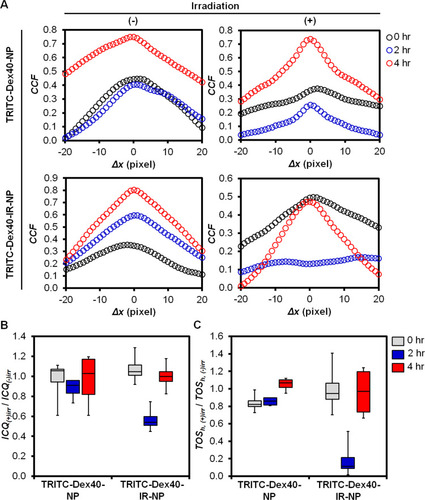
Figure 10 Negative-stained TEM images of (A) IR-NP, (B) BCIP-IR-NP, (C) corresponding intensity-weighted hydrodynamic size distribution, (D) correlograms, and (E) absorption spectra. Scale bar = 100 nm.
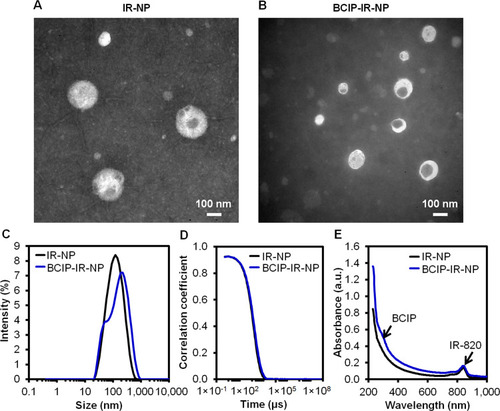
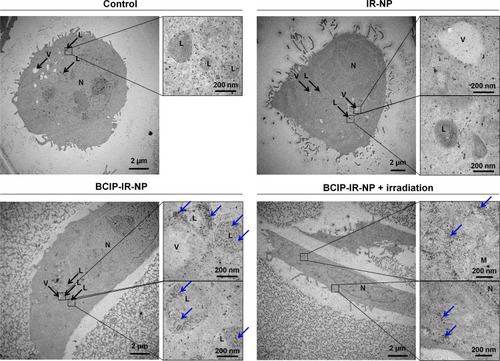
Figure 11 Ultra-thin section of the TEM images of the HaCaT keratinocytes treated with IR-NP and BCIP-IR-NP with and without 830-nm irradiation at 20 J/cm2 post-treatment. Possible dehydroindigo precipitates are indicated by blue arrows. The scale bars are displayed on each image.