
Figures & data
Table 1 Inhibitors Used in the Transport Study
Figure 1 (A) Schematic representation of ion-pairing complex formation between OP and DLM, and the self-assembled micellar structure of ODSF in the aqueous phase. (B) Powder X-ray diffraction patterns and (C) differential scanning calorimetric thermograms of pure OP, DLM, P188, OP/DLM, ODSF, and a physical mixture of OP, DLM, and P188.
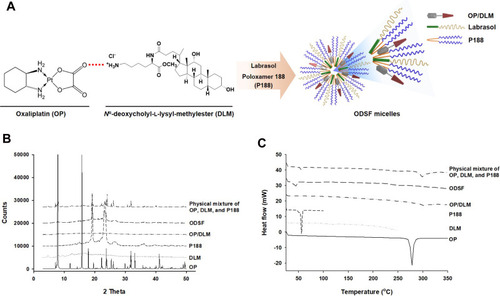
Figure 2 (A) Particle size, (B) zeta potential distribution, and (C) a transmission electron micrograph of ODSF micelles. Scale bar: 200 nm.
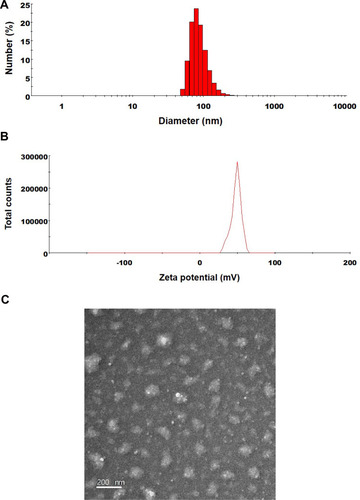
Table 2 Effective and Apparent Permeabilities of OP, OP/DLM, OP-SF, and ODSF
Figure 3 (A) Effects of various intestinal transport inhibitors on the relative apparent permeability of ODSF across a Caco-2 cell monolayer. ***P<0.001 compared to the Papp of ODSF in the absence of all inhibitors (untreated control). (B) Prediction of a role for P-gp in intestinal absorption of ODSF. *P<0.05, **P<0.01, ***P<0.001 compared to the Papp (A to B) of ODSF in the absence of all inhibitors (untreated control); #P<0.05, ###P<0.001 compared to the Papp (B to A) of ODSF in the absence of all inhibitors; $$$P<0.001 compared to the Papp (A to B) of ODSF in the absence of all inhibitors except Cys A. (C) Papp values with or without EGTA, in the presence or absence of all inhibitors except Cys A. **P<0.01, compared to the Papp without EGTA, in the absence of all inhibitors except Cys A; ###P<0.001 compared to the Papp after treatment with EGTA, in the absence of all inhibitors except Cys A; $P<0.05 compared to the Papp without EGTA, in the presence of all inhibitors except Cys A.
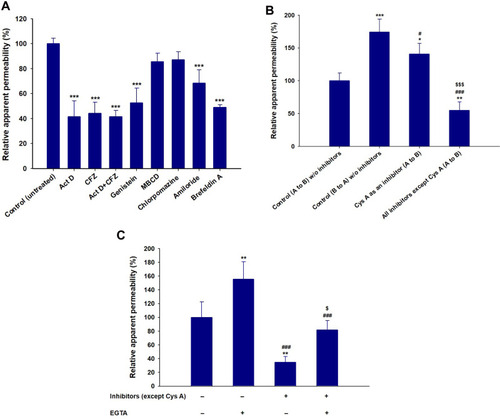
Figure 4 In vitro cytotoxic effects of OP, DLM, OP/DLM, DLM/P188, blank-ODSF, and ODSF on (A) Caco-2 and (B) Madin–Darby Canine Kidney (MDCK) cells.
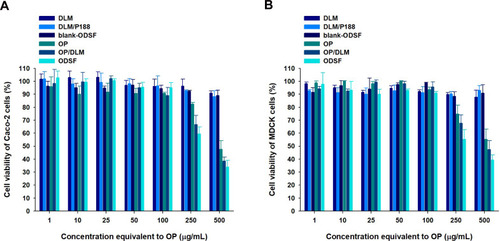
Figure 5 In vitro cumulative percentage release of OP and ODSF at (A) pH 1.2 and (B) pH 6.8.
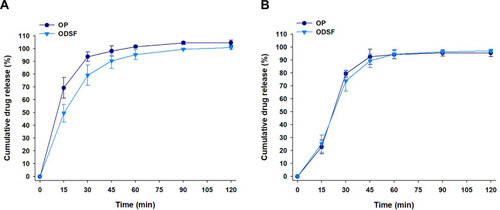
Table 3 Stability of ODSF
Table 4 Pharmacokinetic Parameters of OP in Rats After IV Injection of OP and Oral Administration of OP-S or ODSF with Various Levels of OP
Figure 6 Venous plasma concentration–time profiles of OP after a single (A) IV dose (5 mg/kg) and (B) oral administration of OP in aqueous solution (OP-S, 10 mg/kg), ODSF equivalent to 2.5 mg/kg OP [ODSF (2.5)], ODSF equivalent to 10 mg/kg OP [ODSF (10)], and ODSF equivalent to 20 mg/kg OP [ODSF (20)] to rats.
![Figure 6 Venous plasma concentration–time profiles of OP after a single (A) IV dose (5 mg/kg) and (B) oral administration of OP in aqueous solution (OP-S, 10 mg/kg), ODSF equivalent to 2.5 mg/kg OP [ODSF (2.5)], ODSF equivalent to 10 mg/kg OP [ODSF (10)], and ODSF equivalent to 20 mg/kg OP [ODSF (20)] to rats.](/cms/asset/2bdb147e-5879-40f7-bf0c-52ca45b44426/dijn_a_12194817_f0006_b.jpg)
Table 5 Pharmacokinetic Parameters of OP in Monkeys After IV Injection of OP and Oral Administration of OP-S or ODSF
Figure 7 Venous plasma concentration–time profiles of OP after a single IV dose of OP (OP-IV, 2 mg/kg) and oral administration of OP in aqueous solution (OP-S, 10 mg/kg) or ODSF (equivalent to 10 mg/kg OP) to monkeys.
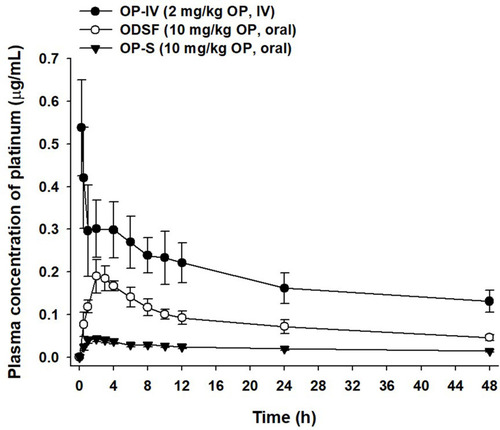
Figure 8 In vivo analyses of the inhibitory effects of the following on tumor growth in CT26 tumor-bearing mice: biweekly intravenous administration of 3.3 mg/kg OP [OP-IV (3.3)] and 10 mg/kg OP [OP-IV (10)]; once-daily oral administration of 10 mg/kg OP in aqueous solution (OP-S); once-daily oral administration of ODSF as 2.5 mg/kg OP [ODSF (2.5)]; once-daily oral administration of ODSF as 10 mg/kg OP [ODSF (10)]; and once-daily oral administration of ODSF as 20 mg/kg OP [ODSF (20)], for 21 days. (A) Tumor volumes in mice [aP< 0.05, bP<0.01, cP<0.001 compared to the control. dP<0.01, eP<0.001 compared to OP-IV (3.3). fP<0.05, gP<0.01 compared to OP-IV (10). hP<0.001 compared to OP-S (10). iP<0.001 compared to ODSF (2.5)]. (B) Photographs of tumors isolated from each group on day 21. Scale bar: 10 mm. (C) Tumor weights in CT26 tumor-bearing mice on day 21 [aP<0.05, bP<0.001 compared to the control. cP<0.05 compared to OP-IV (10). dP<0.05 compared to OP-S (10). eP<0.05 compared to ODSF (2.5)]. (D) Changes in mouse body weights during treatment [aP<0.05, bP<0.001 compared to the control. cP<0.001 compared to OP-IV (3.3). dP<0.01, eP<0.001 compared to OP-IV (10). fP<0.01, gP<0.001 compared to OP-S (10). hP<0.001 compared to ODSF (2.5). iP<0.05 compared to ODSF (10)]. (E) Representative cross-sectional images of isolated tumor tissues obtained 21 days after various treatments, stained as follows: With anti-CD31 antibody, indicating microvessels (brown); anti-proliferating cell nuclear antigen (PCNA) antibody, indicating proliferating cells (brown); and via fluorescent terminal deoxynucleotidyl transferase-mediated dUPT nick-end labeling (TUNEL), indicating apoptosis (green fluorescence). Scale bars: 50 μm for anti-CD31 antibody and anti-PCNA antibody staining; 20 μm for TUNEL staining.
![Figure 8 In vivo analyses of the inhibitory effects of the following on tumor growth in CT26 tumor-bearing mice: biweekly intravenous administration of 3.3 mg/kg OP [OP-IV (3.3)] and 10 mg/kg OP [OP-IV (10)]; once-daily oral administration of 10 mg/kg OP in aqueous solution (OP-S); once-daily oral administration of ODSF as 2.5 mg/kg OP [ODSF (2.5)]; once-daily oral administration of ODSF as 10 mg/kg OP [ODSF (10)]; and once-daily oral administration of ODSF as 20 mg/kg OP [ODSF (20)], for 21 days. (A) Tumor volumes in mice [aP< 0.05, bP<0.01, cP<0.001 compared to the control. dP<0.01, eP<0.001 compared to OP-IV (3.3). fP<0.05, gP<0.01 compared to OP-IV (10). hP<0.001 compared to OP-S (10). iP<0.001 compared to ODSF (2.5)]. (B) Photographs of tumors isolated from each group on day 21. Scale bar: 10 mm. (C) Tumor weights in CT26 tumor-bearing mice on day 21 [aP<0.05, bP<0.001 compared to the control. cP<0.05 compared to OP-IV (10). dP<0.05 compared to OP-S (10). eP<0.05 compared to ODSF (2.5)]. (D) Changes in mouse body weights during treatment [aP<0.05, bP<0.001 compared to the control. cP<0.001 compared to OP-IV (3.3). dP<0.01, eP<0.001 compared to OP-IV (10). fP<0.01, gP<0.001 compared to OP-S (10). hP<0.001 compared to ODSF (2.5). iP<0.05 compared to ODSF (10)]. (E) Representative cross-sectional images of isolated tumor tissues obtained 21 days after various treatments, stained as follows: With anti-CD31 antibody, indicating microvessels (brown); anti-proliferating cell nuclear antigen (PCNA) antibody, indicating proliferating cells (brown); and via fluorescent terminal deoxynucleotidyl transferase-mediated dUPT nick-end labeling (TUNEL), indicating apoptosis (green fluorescence). Scale bars: 50 μm for anti-CD31 antibody and anti-PCNA antibody staining; 20 μm for TUNEL staining.](/cms/asset/67234a00-dfd6-41e4-8789-e12ad6b43d7b/dijn_a_12194817_f0008_c.jpg)
Figure 9 Antitumor effects of ODSF at various doses in HCT116 tumor-bearing mice after biweekly intravenous administration of 3.3 mg/kg OP [OP-IV (3.3)] and 10 mg/kg OP [OP-IV (10)]; once-daily oral administration of 10 mg/kg OP in aqueous solution (OP-S); once-daily oral administration of ODSF as 2.5 mg/kg OP [ODSF (2.5)]; once-daily oral administration of ODSF as 10 mg/kg OP [ODSF (10)]; and once-daily oral administration of ODSF as 20 mg/kg OP [ODSF (20)], for 21 days. (A) Tumor volumes in different groups [aP<0.05, bP<0.01, cP<0.001 compared to the control. dP<0.01 compared to OP-IV (3.3). eP<0.05 compared to ODSF (2.5)]. (B) Photographs of tumors isolated from each group on day 21. Scale bar: 10 mm. (C) Isolated tumor weights in HCT116 tumor-bearing mice on day 21 [aP<0.01, bP<0.001 compared to the control. cP<0.05, dP<0.01 compared to OP-IV (3.3). eP<0.05 compared to ODSF (2.5)]. (D) Changes in mouse body weight during treatment [aP<0.001 compared to the control. bP<0.001 compared to OP-IV (3.3). cP<0.001 compared to OP-IV (10). dP<0.001 compared to OP-S (10). eP<0.01, fP<0.001 compared to ODSF (2.5). hP<0.001 compared to ODSF (10)]. (E) Representative cross-sectional images of isolated tumor tissues obtained 21 days after various treatments, stained as follows: With anti-CD31 antibody, indicating microvessels (brown); with anti-proliferating cell nuclear antigen (PCNA) antibody, indicating proliferating cells (brown); and via fluorescent terminal deoxynucleotidyl transferase-mediated dUPT nick end labeling (TUNEL), indicating apoptosis (green fluorescence). Scale bars: 50 μm for anti-CD31 antibody and anti-PCNA antibody staining, and 20 μm for TUNEL staining.
![Figure 9 Antitumor effects of ODSF at various doses in HCT116 tumor-bearing mice after biweekly intravenous administration of 3.3 mg/kg OP [OP-IV (3.3)] and 10 mg/kg OP [OP-IV (10)]; once-daily oral administration of 10 mg/kg OP in aqueous solution (OP-S); once-daily oral administration of ODSF as 2.5 mg/kg OP [ODSF (2.5)]; once-daily oral administration of ODSF as 10 mg/kg OP [ODSF (10)]; and once-daily oral administration of ODSF as 20 mg/kg OP [ODSF (20)], for 21 days. (A) Tumor volumes in different groups [aP<0.05, bP<0.01, cP<0.001 compared to the control. dP<0.01 compared to OP-IV (3.3). eP<0.05 compared to ODSF (2.5)]. (B) Photographs of tumors isolated from each group on day 21. Scale bar: 10 mm. (C) Isolated tumor weights in HCT116 tumor-bearing mice on day 21 [aP<0.01, bP<0.001 compared to the control. cP<0.05, dP<0.01 compared to OP-IV (3.3). eP<0.05 compared to ODSF (2.5)]. (D) Changes in mouse body weight during treatment [aP<0.001 compared to the control. bP<0.001 compared to OP-IV (3.3). cP<0.001 compared to OP-IV (10). dP<0.001 compared to OP-S (10). eP<0.01, fP<0.001 compared to ODSF (2.5). hP<0.001 compared to ODSF (10)]. (E) Representative cross-sectional images of isolated tumor tissues obtained 21 days after various treatments, stained as follows: With anti-CD31 antibody, indicating microvessels (brown); with anti-proliferating cell nuclear antigen (PCNA) antibody, indicating proliferating cells (brown); and via fluorescent terminal deoxynucleotidyl transferase-mediated dUPT nick end labeling (TUNEL), indicating apoptosis (green fluorescence). Scale bars: 50 μm for anti-CD31 antibody and anti-PCNA antibody staining, and 20 μm for TUNEL staining.](/cms/asset/ec4810d2-f41a-402b-a9f4-42fa65a4d8b3/dijn_a_12194817_f0009_c.jpg)