Figures & data
Figure 1 General view of the MgF2 NPs synthesis and NPs deposition on catheter walls by sonochemistry. MgF2 (black spheres) formation under ultrasonic irradiation (red waves). Microjets (blue arrows) were formed after the collapse of the acoustic bubble near the catheter wall and throw the NPs to create MgF2 NP-coating.
Abbreviation: NPs, nanoparticles.
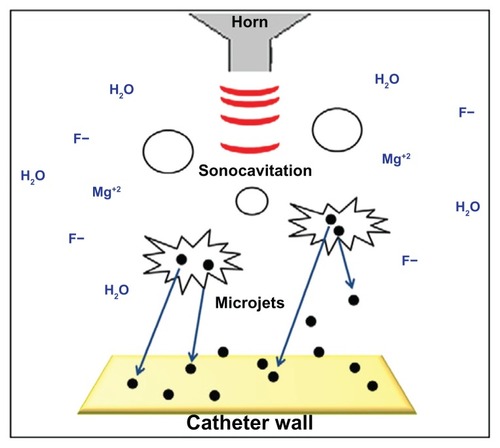
Figure 2 Imaging of sonochemical MgF2 NP catheter coating. Catheters were coated using a sonochemical procedure described in the experimental section. HR SEM images of the lateral sections of the internal and external walls of uncoated and MgF2 NP-coated catheters are presented. Inserts provide an enlarged view of the coating showing the typical spherical MgF2 NP structure.
Note: Black arrows indicate the thickness of the MgF2 NP coating.
Abbreviations: HR SEM, high resolution scanning electron microscope; NP, nanoparticle.
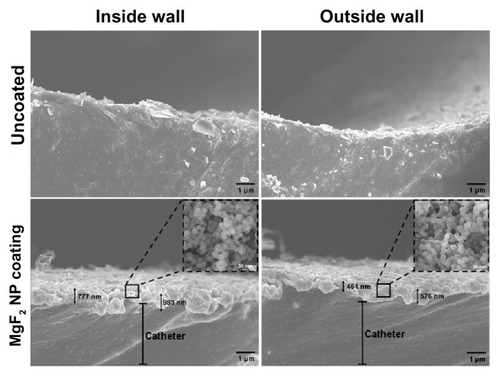
Figure 3 Distribution of the MgF2 NP coating on the catheter’s surface. Elemental mapping analysis of magnesium (red) and fluor (purple). The signals were detected from the internal and external sides of coated and uncoated catheters with MgF2 NPs.
Abbreviation: NP, nanoparticle.
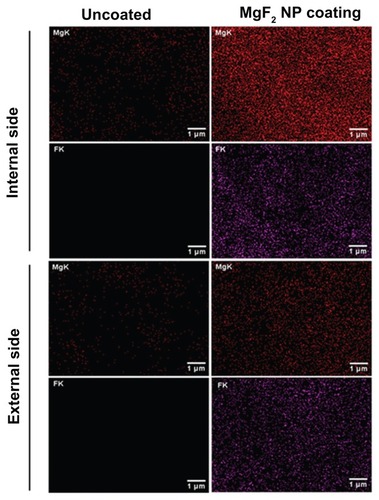
Figure 4 Catheter surface topography after incubation with biological fluids. HR SEM images of the inside and outside walls of MgF2 NP-coated catheters after 7 days exposure in TSB, TSB-Glu, urine, and plasma, as described in the experimental section.
Abbreviations: Glu, glucose; HR SEM, high resolution scanning electron microscope; NP, nanoparticle; TSB, tryptic soy broth.
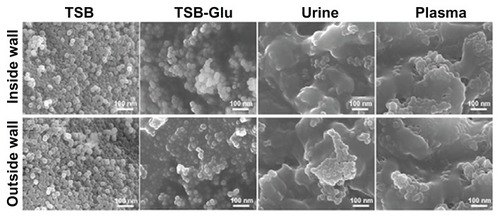
Figure 5 Amount of Mg+2 released over time from MgF2 NP-coated catheters. Coated catheters were incubated for 7 days in various fluids (TSB, TSB-Glu, urine and plasma) as described in the experimental section. The Mg+2 released from the coating of the (A) external wall and the (B) internal wall are presented. The Mg+2 concentration released following the incubation was determined by the difference in the Mg+2 concentration present in normal levels in TSB, TSB-Glu, urine, plasma and the concentrations measured at each time point.
Note: Data represent the mean ± SD values of three independent experiments conducted in triplicate.
Abbreviations: Glu, glucose; NP, nanoparticle; SD, standard deviation; TSB, tryptic soy broth.
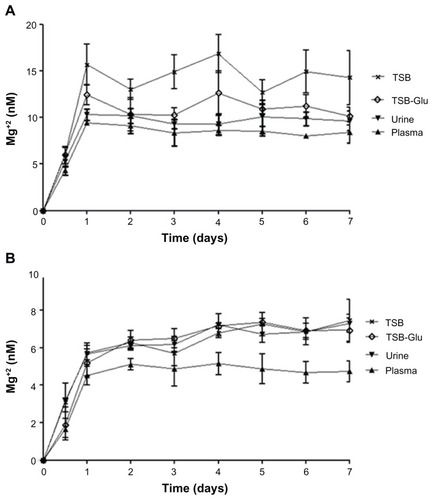
Table 1 Antibiofilm properties of the catheter walls coated with MgF2 NP against Escherichia coli biofilm formation
Table 2 Antibiofilm properties of the catheter walls coated with MgF2 NP against Staphyloccocus aureus biofilm formation
Table 3 Cytotoxicity of MgF2 NP-coated catheter on mitochondrial activity
Figure 6 Biocompatibility of MgF2 NP-coated catheters. Left column: DIC imaging of HeLa cells grown on uncoated and MgF2 NP-coated catheters for 24 hours. Right column: Fluorescence microscopy overlay of the DNA (blue) and β-tubulin (red) of the same cells imaged by DIC.
Abbreviations: DIC, differential interference contrast; NP, nanoparticle.
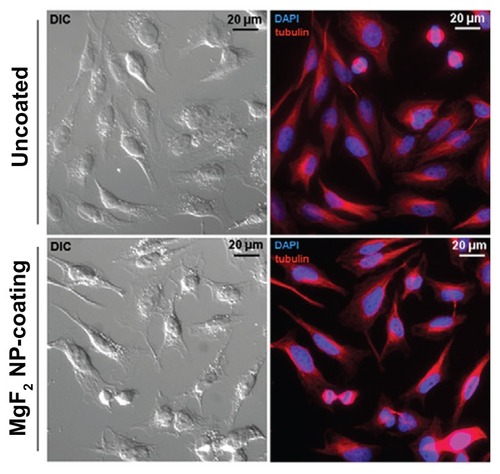
Figure S1 MgF2 NP characterization. (A) XRD patterns of MgF2 NPs with the Miller indices of the respective atomic planes; (B) HR SEM image; (C) size distribution; and (D) HR TEM micrograph of MgF2 NPs and the 110 plane.
Abbreviations: HR SEM, high resolution scanning electron microscope; HR TEM, high resolution transmission electron microscope; NP, nanoparticle; XRD, X-ray diffraction.
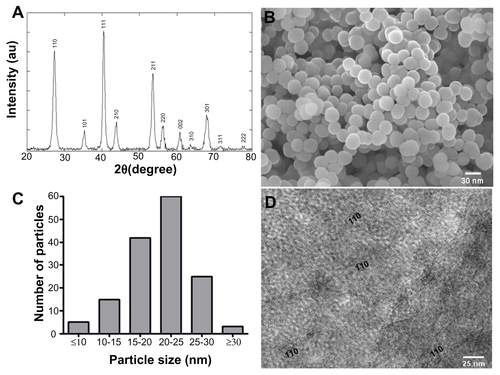
Table S1 Influence of Mg+2 and F− on the Escherichia coli biofilm formation on the catheter walls
Table S2 Influence of Mg+2 and F− on the Staphylococcus aureus biofilm formation on the catheter walls