Figures & data
Figure 1 Preparation processes of the latent membrane protein 1 surface-enhanced Raman scattering probe-based immunoassay. (A) Schematic illustration of the preparation processes of 4-mercaptobenzoic acid-labeled Au/Ag core-shell nanoparticles; (B) schematic procedure of a direct binding assay.
Abbreviations: 4-MBA, 4-mercaptobenzoic acid; BSA, bovine serum albumin; LMP1, latent membrane protein 1.
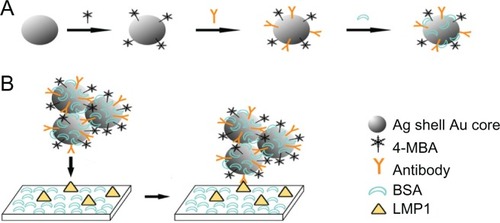
Figure 2 (A) Transmission electron microscopic images of Au/Ag core-shell nanoparticle colloids (left) and composite nanoparticles with 4-mercaptobenzoic acid (right); (B) ultraviolet-visible absorption spectra of pure Au/Ag core-shell nanoparticles colloid (black curve) and Au/Ag core-shell nanoparticles with 4-mercaptobenzoic acid (red curve); (C) surface-enhanced Raman scattering spectra of 4-mercaptobenzoic acid adsorbed onto gold nanoparticles, silver nanoparticles, and Au/Ag core-shell nanoparticles, respectively.
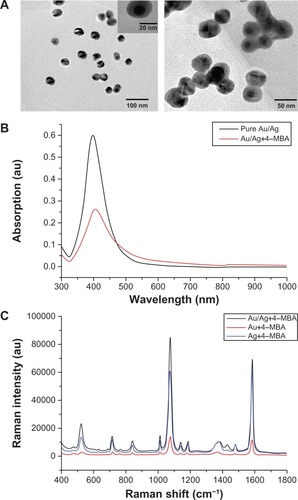
Figure 3 Raman spectra of Au/Ag core-shell colloids (A) and solid 4-mercaptobenzoic acid (B), as well as the surface-enhanced Raman scattering spectra of 4-mercaptobenzoic acid Au/Ag nanoparticles (C), latent membrane protein 1 Au/Ag nanoparticles (D), and 4-mercaptobenzoic acid latent membrane protein 1 Au/Ag nanoparticles (E), respectively.
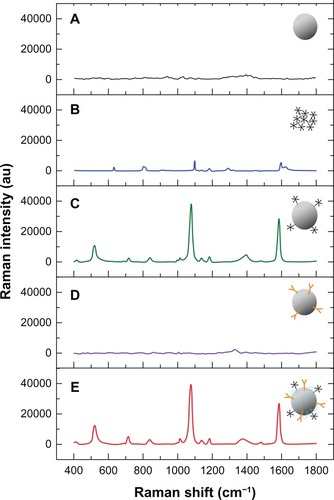
Figure 4 (A) and (B) Bright field images of a region from examples of normal and cancerous nasopharyngeal tissue sections, respectively; (C) are the representative spectra obtained from latent membrane protein 1 surface-enhanced Raman scattering probes in cancerous nasopharyngeal tissue (red), normal nasopharyngeal tissue (blue) and glass (black), as well as nontargeted surface-enhanced Raman scattering probes (bovine serum albumin surface-enhanced Raman scattering probes) in cancerous nasopharyngeal tissue (green); (D) and (E) demonstrate surface-enhanced Raman scattering images of example of normal tissue and cancerous tissue, respectively. The surface-enhanced Raman scattering images were acquired by scanning the laser beam to cover the white boxes in (A) and (B), respectively.
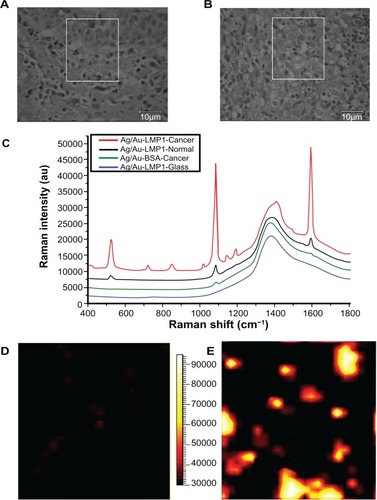
Figure S1 Transmission electron microscopic images of the Au/Ag core-shell nanoparticles (A) and pure silver nanoparticles (B).
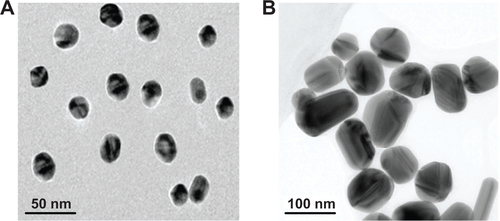
Figure S2 A biopsy specimen obtained from a patient with undifferentiated nonkeratinizing nasopharyngeal carcinoma: (A) hematoxylin-eosin staining (×100); (B) cytoplasmic staining of latent membrane protein 1 by immunohistochemistry (stained in brown) (×100) (C) in situ hybridization for Epstein–Barr virus-encoded small RNA (positive, stained in brown, ×100).
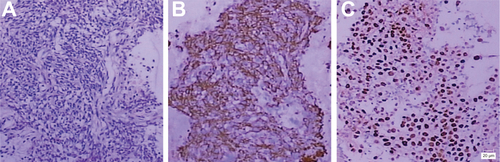
Figure S3 (A) and (B) Bright field images of a region from normal and cancerous nasopharyngeal tissue sections, respectively; (C) and (D) demonstrate surface-enhanced Raman scattering images of normal tissue and cancerous tissue, respectively. The surface-enhanced Raman scattering images were acquired by scanning the laser beam to cover the white boxes in (A) and (B), respectively.
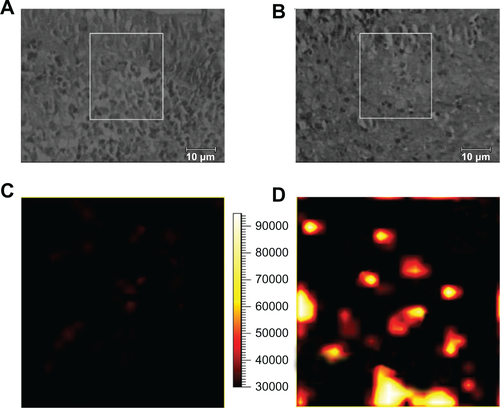
Figure S4 (A) and (B) Bright field images of a region from normal and cancerous nasopharyngeal tissue sections, respectively; (C) and (D) demonstrate surface-enhanced Raman scattering images of normal tissue and cancerous tissue, respectively. The surface-enhanced Raman scattering images were acquired by scanning the laser beam to cover the white boxes in (A) and (B) respectively.
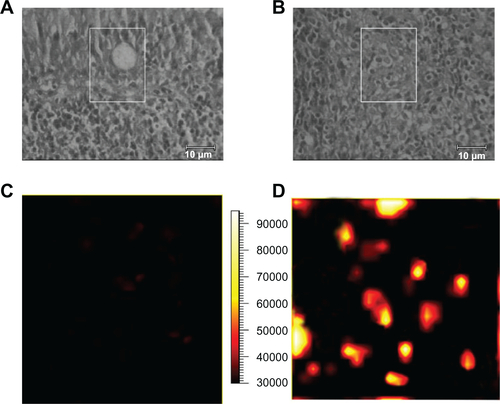
Table S1 Summary of clinical data from patients and results of LMP1 surface-enhanced Raman scattering and LMP1 immunohistochemistry staining, as well as EBER-ISH