Figures & data

Table 1 Real-time Polymerase Chain Reaction Primers used in this Study
Figure 1 Top view SEM images and AFM 3D images of different samples.
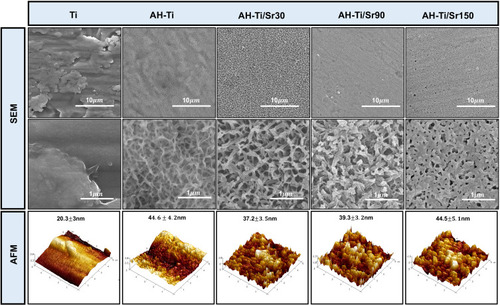
Figure 2 XRD patterns of different samples.
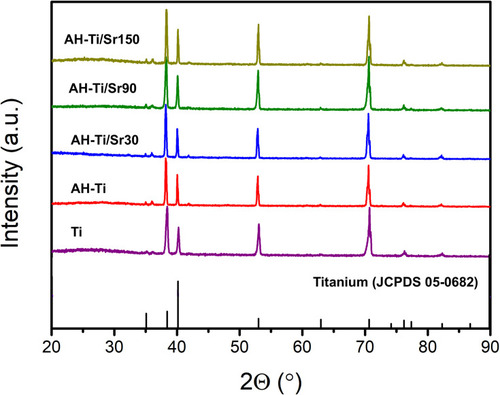
Figure 3 (A) EDS mapping of the area enclosed by a square in SEM images showing the distribution of Ti, O, Na, and Sr elements (n=6). (B) Water contact angle measurement of different specimens (n=6), *P<0.01. (C) The released profiles of Sr2+ from AH-Ti/Sr substrates within 28 days (n=6). (D) The accumulated Sr2+ concentration from AH-Ti/Sr substrates within 28 days (n=6).
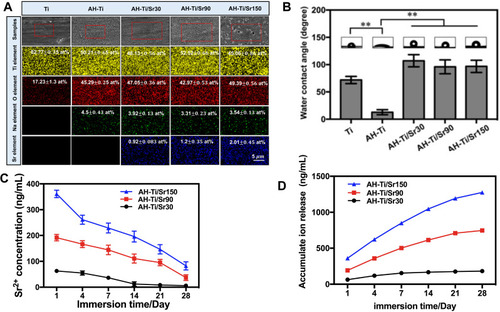
Figure 4 Cross-sectional SEM images and thickness statistics of SrTiO3 coatings of 30 and 90 min.
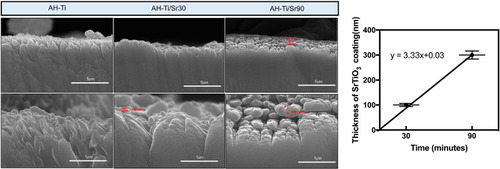
Figure 5 (A) Cell morphology of MC3T3-E1 on different samples observed by FM and SEM (n=6). (B) The statistical analysis of cell area, *P<0.05, **P<0.01. (C) The statistical analysis of cell aspect ratio, *P<0.05, **P<0.01.
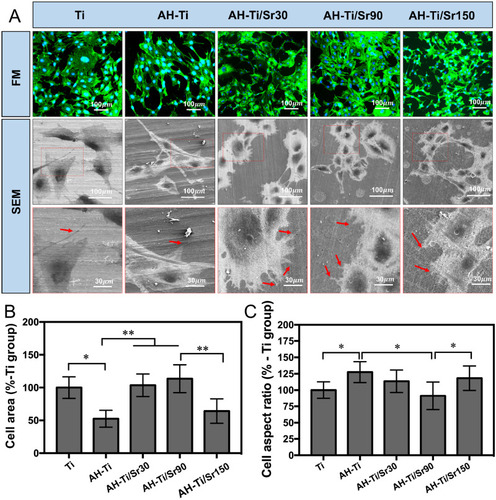
Figure 6 (A) Cell proliferation of MC3T3-E1 on different samples after four and seven days of cell culture (n=6). (B) ALP activity of MC3T3-E1 on different samples after seven and 14 days of osteogenic induction (n=6). (C) Mineralization level of MC3T3-E1 on different samples after 14 days of osteogenic induction (n=6). (D) OCN concentration of MC3T3-E1 on different samples after 14 days of osteogenic induction (n=6). (E) The osteogenic related gene expression of different samples at seven days (n=6). *P<0.05, **P<0.01.
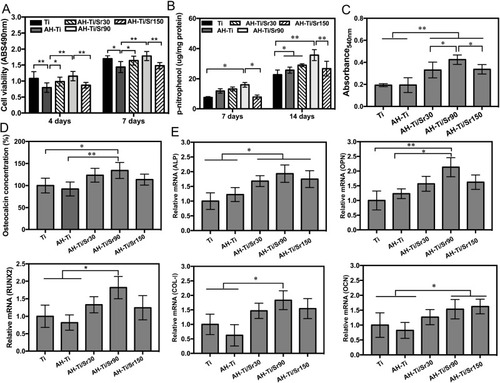
Figure 7 (A) Cell morphology of Raw264.7 on different samples observed by FM and SEM (n=6). (B) Cell viability of Raw264.7 on different samples after four and seven days of cell culture (n=6). (C) The relative expression of RANKL and TRAP genes of Raw264.7 on different samples (n=6). *P<0.05, **P<0.01.
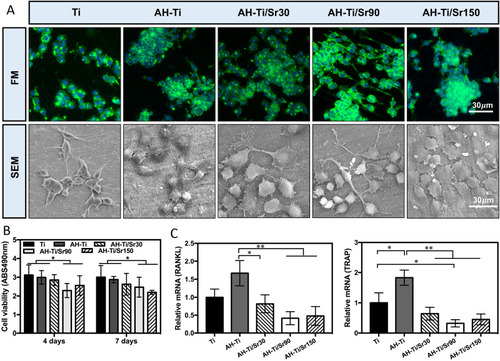
Figure 8 Micro-CT images of reconstructed 3D models of surrounding bones with implants.
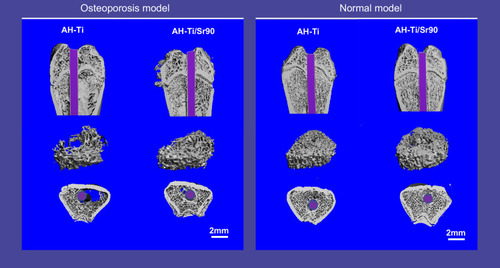
Figure 9 Corresponding quantitative analysis results of BV/TV, Tb.N, Tb.Th, Tb.Sp and Conn-Dens. *P<0.05, **P<0.01.
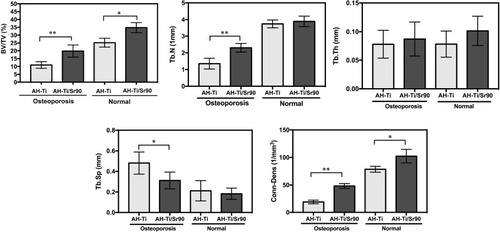
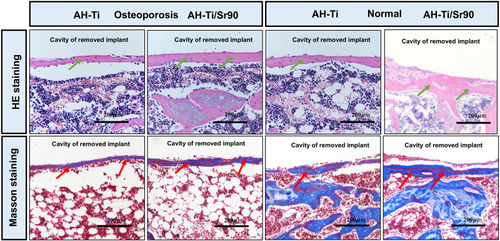
Figure 10 Histological analysis of new bone formation around the implants.