Figures & data
Table 1 Composition of Different Niosomal Formulations
Figure 1 Solubility profile of CsA with nonionic surfactants at pH 1.2 and 7.4.
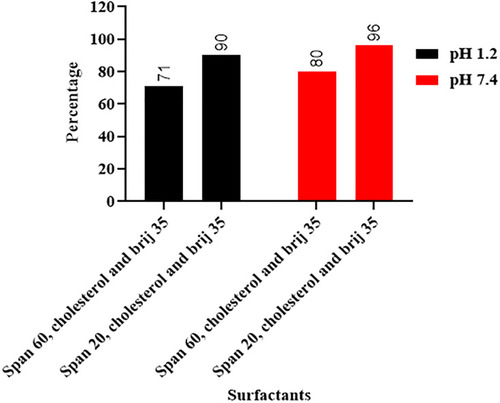
Figure 2 DSC thermograms of Span 20, Brij 35, physical mixture 3 (PM3), physical mixture 4 (PM4), F7, F8, F9, F10 and F11 formulations.
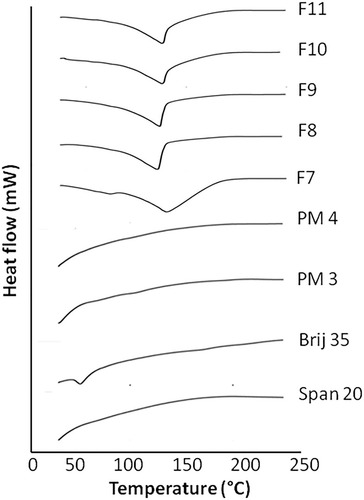
Table 2 Mean Size, Polydispersity Index and Zeta Potential of Niosomal Formulations
Figure 3 Size (A) and zeta potential (B) of niosomal formulations.
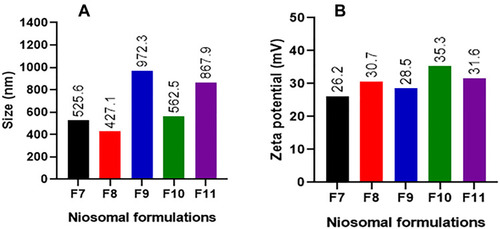
Figure 4 SEM appearance of optimized formulation F10.
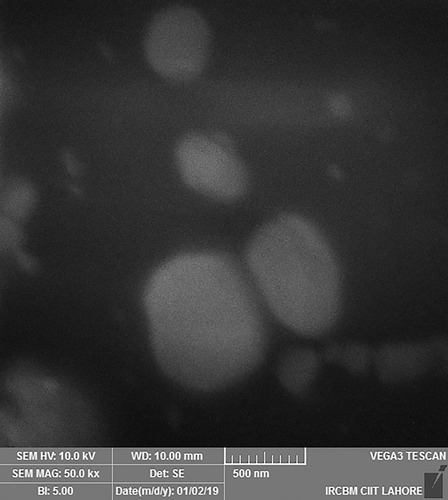
Table 3 Atomic % and Weight % of Elements in EDX Spectra of Formulation F10
Figure 5 EDX spectra of selected niosomal formulation F10.
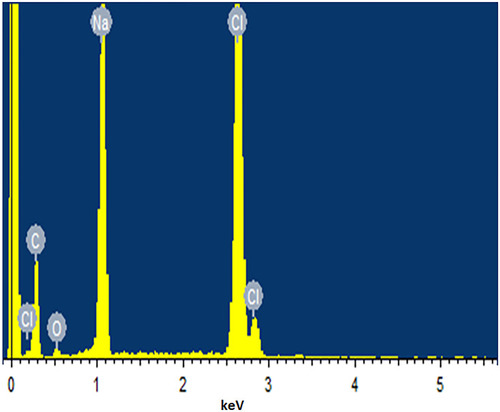
Table 4 Mean Entrapment Efficiency of Niosomal Formulations
Table 5 Change in Vesicle Size, PDI and Zeta Potential of Niosomal Formulations F7-F11 at Temperature 4–8 °C in Three Months
Table 6 Change in Size, PDI and Zeta Potential of Preparations F7-F11 at Temperature 25± 2 °C in Three Months
Table 7 Stability Studies of Cyclosporine a Niosomes at Different Temperatures
Figure 6 Drug release profiles of formulations F7-F11 and drug aqueous suspension at pH 1.2.
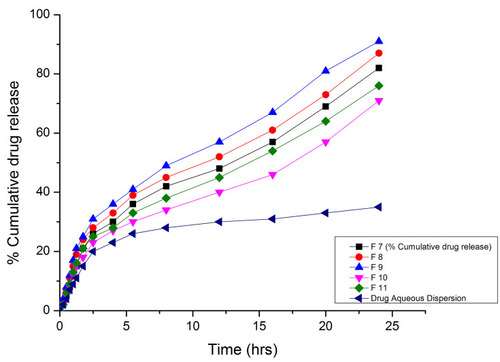
Figure 7 Drug release profiles of formulations F7-F11 and drug aqueous suspension at pH 7.4.
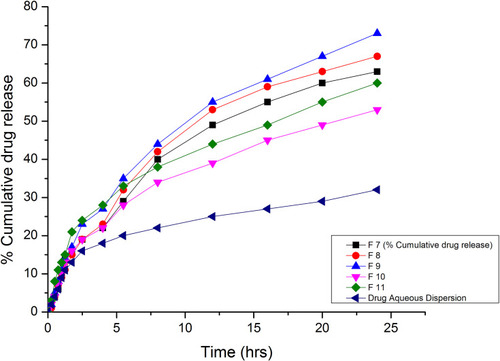
Table 8 Drug Release Data and Kinetic Modeling of Formulations F7-F11 at pH 1.2 and 7.4
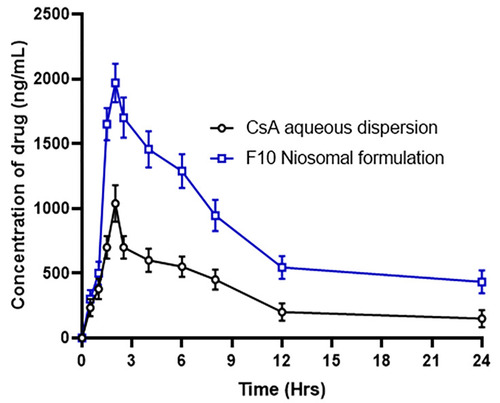
Table 9 Mean Pharmacokinetic Parameters of Niosomal Formulations F10 and CsA Aqueous Dispersion Administered in Dose (10 Mg/Kg) Orally to Albino Rabbits (n=6)
Figure 8 Pharmacokinetic profile of F10 niosomal formulation and aqueous dispersion of CsA in healthy albino rabbits.