Figures & data
Figure 1 Schematics of novel AAV2-VLPs siRNA delivery design strategy and their use in cancer therapy AAV2 cap gene was previously constructed into baculovirus vector (denoted as BAC-cap) under polyhedrin (polh) promoters for high amplification. The AAV2-VLPs were produced in bioreactor by infection of insect cells with BAC-cap. The generated crude AAV2-VLPs were purified by chromatography. For siRNA delivery, cationic polymer polyethylene imine (PEI) were applied to coat negative charged AAV-VLPs by electrostatic interactions. Delivery of cell death siRNA in breast cancer cells led to destruction of cancer cells.
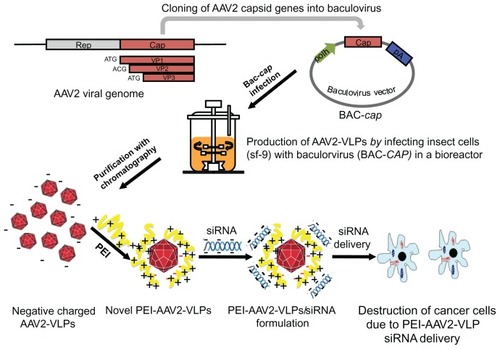
Figure 2 Effect of baculovirus dosage on production of AAV2-VLPs in insect cell/BEV system (A) ELISA of assembled AAV2-VLPs with different baculovirus infection moi at different post infection time points (B) Western blot of AAV2-VLP constitution proteins at 72 hrs post infection. The sf-9 cells (at density of 2 × 10⁶) were infected with baculovirus multiplicity of infection (moi) of 0.1, 1, 3 respectively, assembled VLPs numbers and the expressions of VLP constitution proteins were examined by ELISA and Western blot respectively. ELISA results showed the yield of assembled AAV2-VLPs peaked at 48 hpi for moi 1 and 3; and at 72 hpi for moi 0.1; Western blot showed that the VLP constitution proteins (VP1–3) expressions reached the similar level at end point (72 hpi) for all three different baculovirus infection dosages. The assembled AAV2-VLPs could disassemble with time, although the VLP constitution proteins were not degraded in cellular condition.
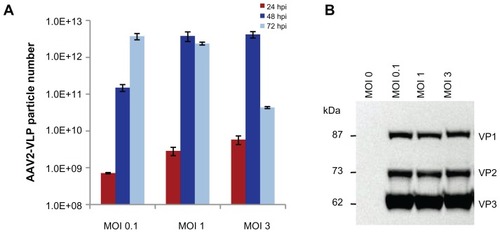
Figure 3 Dynamics of insect cell (sf-9) growth in AAV2-VLPs production with different baculovirus dosages (A) viable cell density (B) cell viability (C) average cell diameters with different infection moi over time. The sf-9 cells (density of 2 × 10⁶) were infected with baculovirus at moi 0.1, 1, 3 respectively, cell density, viability, cell diameter were examined by cell counting system Cedex. With moi 1 and 3, the sf-9 cells increased in size and stop doubling at 24 hpi, but cell enlargement and cease of cell growth were delayed with baculovirus infection of moi 0.1. So, baculovirus infection dosage of moi 1 was adequate for synchronizing the infection at 24 hpi.
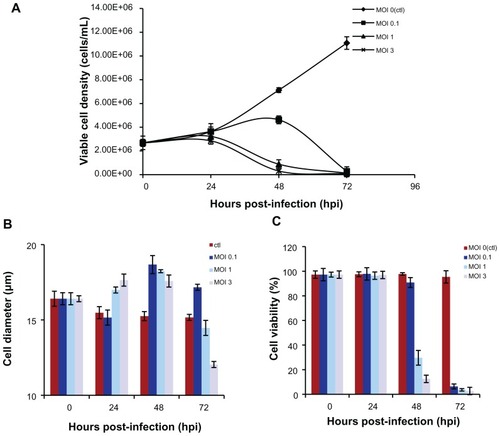
Figure 4 Purification and Characterization of AAV2-VLPs (A) step 1: ion exchange chromatography (IEC) (B) step 2: hydrophobic interaction chromatography (HIC) (C) western blot of purified AAV2-VLPs (D) TEM image of purified AAV2-VLPs. The entire 2.5 L of cell lysates from bioreactor were subjected to equilibrated IEC column. During purification process, column pressure, flow rate, conductivity and UV of flow through were monitored. The column was washed with buffer containing 150 mM NaCl until a base line was reached. A step change of 340 mM NaCl was applied to elute AAV2-VLPs. There were 2 elution peaks detected by UV. AAV2-VLPs were eluted in the second elution peak. The fraction containing AAV2-VLPs was collected and adjusted to 1.5 M (NH4)2SO4 concentration and then loaded to HIC column. In HIC column, a concentration gradient from 1500 to 0 mM (NH4)2SO4 was applied to elute AAV2-VLPs. Pure AAV2-VLPs was detected in the fraction between 962 and 625 mM of (NH4)2SO4 (indicated with black arrow). Constitution proteins of purified AAV2-VLPs were examined by western blot, band density band intensity analysis displayed protein ratio of 1:1:8 (VP1–3). TEM analysis showed that the morphology of pure AAV2-VLPs was round in shape with size of around 20 nm, which was similar to that of reported wildtype AAV2 capsids.
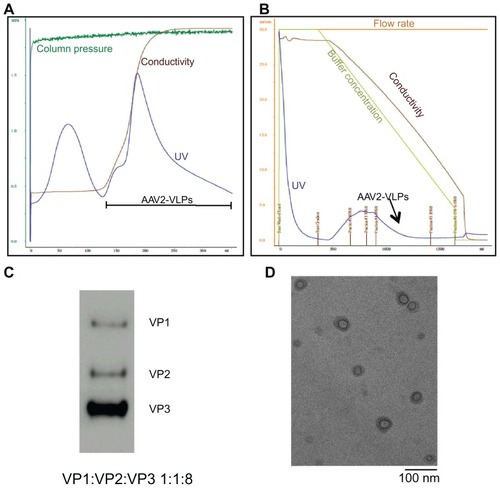
Figure 5 Investigation of PEI and AAV2-VLPs interaction by zeta potential analysis. The PEI coating amount evaluated in the range of 1 × 10⁻⁸ to 3.2 × 10⁻⁶ μg/VLP. After coating, the excess PEI was removed by washing with 100 kDa cut-off centrifugation column. Zeta potential of PEI-AAV2-VLPs was measured in PBS buffer (pH 7.4). Total of five measurements were taken from each points. The results were plotted as means ± standard error. Coating of PEI led to a sharp increase of zeta potential of particles from −11 to +11.9 mV within 5 × 10⁻⁸ μg/VLP of PEI used. The amount of PEI in transition point (5 × 10⁻⁸ μg/VLP) was determined as the minimum amount for forming a stable layer on AAV2-VLP surface.
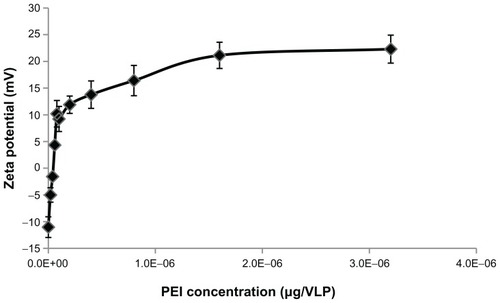
Figure 6 PEI-AAV2-VLPs Cytotoxicity evaluation MCF-7 cells were incubated with PEI-AAV2-VLPs at increased VLP-to-cell ratio for 8 and 24 hrs respectively. Cell viability was measured by MTS assay. Cell viability in untreated groups was assigned as 100% and its O.D from MTS assay was used to calculate cell viability in treatment groups. With treatment dosage of less than 7000:1 VLP-to-cell ratio, toxicity effects were minor (cell viability >90%) for both 8 hr and 24 hr incubations; at maximum dosage tested (VLP-to-cell ratio of 9000:1), cell viability was around 70%.
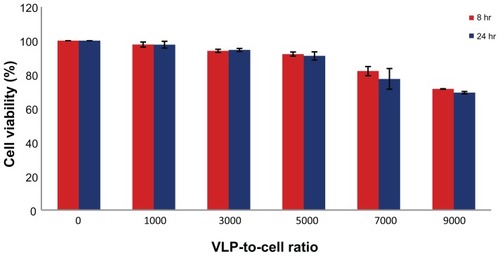
Figure 7 siRNA binding affinity and siRNA protection effect of PEI-AAV2-VLPs. lane 1: free siRNA; lane 2: siRNA incorporated PEI-AAV2-VLPs; lane 3 cell siRNA incorporated PEI-AAV2-VLPs incubated with Rnase A for 1 hr at 37°C. 0.1 μg of siRNA was mixed with 0.5 × 10⁹ PEI-AAV2-VLPs and incubated for 30 min at room temperature to form VLP-siRNA complex, and then incubated with or without RNAse A for 1 hr at 37°C. siRNA migration was assessed by gel electrophoresis using 4% agarose gel. The migration of siRNA was fully arrested due to association with PEIAAV2- VLPs; with RNAase treatment, siRNA was not degraded (lane 3) showing the same pattern as in RNAase untreated one (lane 2).
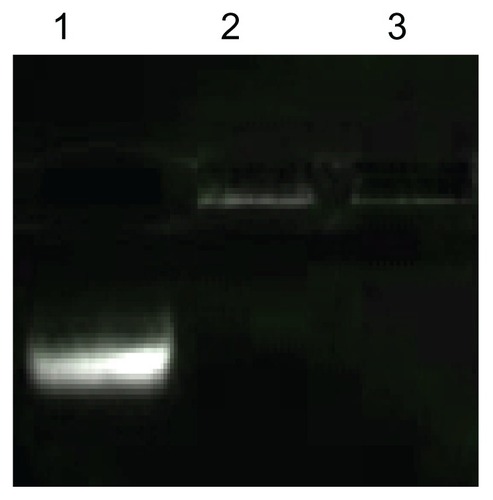
Figure 8 siRNA delivery efficiency of PEI-AAV2-VLPs evaluated by fluorescent siRNA (A) fluorescent microscope images of siRNA transfected MCF-7 under fluorescent light (upper panel) and bright field (lower panel) (B) siRNA delivery efficiency evaluated by fluorescence intensity. The MCF-7 cells were plated at density 1 × 10⁴ cells/well in 96-well plate. 40 ng of siRNA was mixed with PEI-AAV2-VLPs of 1, 3, 5 and 7 × 10⁷ VLPs respectively. After 30 min incubation at room temperature, the preparations were added to each well. After 4 hr of transfection, the cells were viewed under fluorescent microscopy and fluorescence intensity was measured by plate reader. Commercial transfection reagent, HiPerFect, was used as a positive control. The siRNA delivery efficiency with HiPerFect was assigned to 100% and its fluorescent intensity was used to calculate siRNA delivery efficiency with PEI-AAV2-VLPs. Significant fluorescence was observed in MCF-7 cells. The siRNA delivery efficiency was 67%, 70%, 96% and 83% for 1000:1, 3000:1, 5000:1, 7000:1 VLP-to-cell ratio, respectively.
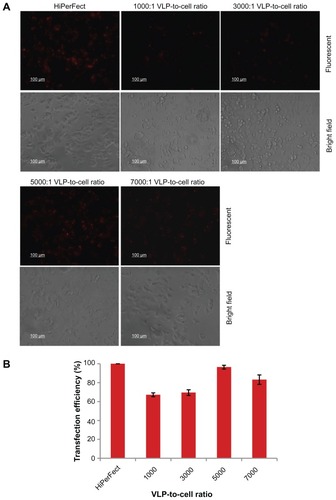
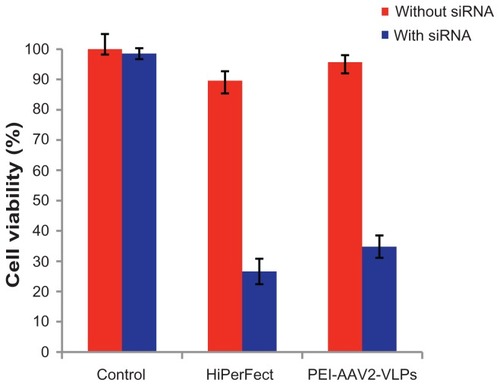
Figure 9 Cell death induced by PEI-AAV2-VLPs delivery of cell death siRNA in MCF-7 cells compared to commercially available siRNA transfection reagent HiPerFect MCF-7 cells were plated in 96-well plate at density of 1 × 10⁴ cells/well. 40 ng of cell death siRNA was mixed with 5 × 10⁷ PEI-AAV2-VLPs and then added to 1 × 10⁴ cells in each well. After 72 hrs of transfection, the cell viability was measured by MTS assay. Cell viability in untreated group was assigned as 100% and its O.D from MTS assay was used to calculate normalized cell viability. Cell death siRNA delivery by HiPerFect caused cell viability to reduce from 90% to 27%; using PEI-AAV2-VLPs for siRNA delivery, cell viability reduced from 98% to 34.8%.