Figures & data
Figure 1 Characterization of r-sEV-AT and p-sEV-AT. (A) Macro and H&E images of native rat and porcine adipose tissue. Scale bar = 100 μm. (B) The morphology of r-sEV-AT and p-sEV-AT was observed by transmission electron microscopy analysis. The black arrows pointed out the sEV-AT. Scale bar = 100 nm. (C) Size distribution of sEV-AT was measured by NanoSight analysis. (D) The expressions of Actin, CD63, TSG101 and CD9 in cell debris, r-sEV-AT and p-sEV-AT were detected by Western blot. (E) The amount of ATE and sEV-AT that could be isolated from 1 g native adipose tissue (n=3).
Abbreviations: ATE, adipose tissue extract; H&E, hematoxylin and eosin; p-sEV-AT, small extracellular vesicles derived from porcine adipose tissue; r-sEV-AT, small extracellular vesicles derived from rat adipose tissue; sEV, small extracellular vesicles; sEV-AT, small extracellular vesicles derived from adipose tissue.
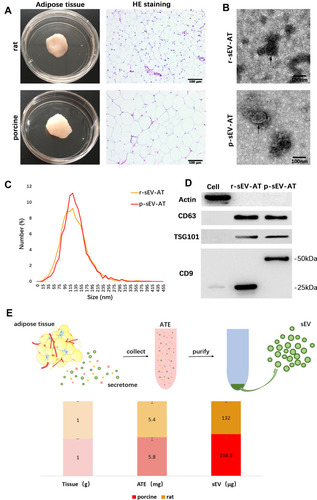
Figure 2 The response of cultured cells to allogeneic and xenogeneic sEV-AT in vitro. (A) The morphology of rASCs and cellular uptake were detected by Fluorescence Confocal Microscopy (red: rASCs, green: sEV-AT, blue: nuclei). After co-cultured rASCs with sEV-AT for (B) 5 days or (C) 10 days, the relative expressions of adipogenic marker genes (PPARγ, C/EBPα, adiponectin and FABP4) were measured by real-time PCR (n=3). (D) Typical tube-like structures of rECs in different groups were shown (left, scar bar=1 mm, right, scar bar=400 μm), and total nodes, total junctions and total length of all tubing per field of view (scar bar=500 μm) were analyzed (n=5). (E) After co-cultured rECs with sEV-AT for 4 days, the relative expressions of angiogenic marker genes (CD31, VEGF, FGF2 and angiogenin) were measured by real-time PCR (n=3). The significance was tested with one-way ANOVA with Tukey posthoc test (*p<0.05, **p<0.01, ***p <0.001).
Abbreviations: C/EBPα, CCAAT enhancer-binding proteins; FABP4, fatty acid-binding protein 4; FGF2, fibroblast growth factor 2; PCR, polymerase chain reaction; PPARγ, peroxisome proliferator-activated receptor γ; p-sEV-AT, small extracellular vesicles derived from porcine adipose tissue; rASCs, rat adipose-derived stromal/stem cells; rECs, rat aorta endothelial cells; r-sEV-AT, small extracellular vesicles derived from rat adipose tissue; sEV-AT, small extracellular vesicles derived from adipose tissue; VEGF, vascular endothelial growth factor.
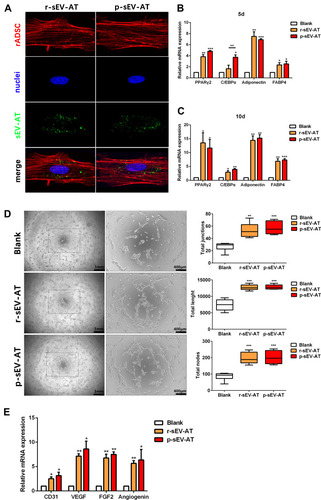
Figure 3 Host cells infiltration induced by allogeneic and xenogeneic sEV-AT in vivo. Host cells infiltration in tubes was measured at 3D, 5D and 7D. (A) Schematic view of the experimental operation process. Matrigel only, or mixed with r-sEV-AT and p-sEV-AT was transferred into the custom-designed silicone tube and subcutaneously implanted it into the back of SD rats. After 3D, 5D and 7D implantation, samples with the tubes were photographed. (B) Macro images of the implants after removing the tubes. (C) Host cells infiltration was confirmed by H&E staining. The solid lines represented the lower edge of the sheet-like panniculus carnosus skeletal muscle in the skin, the dotted lines represented the position where the cell density is significantly reduced and the black arrows represented the thickness of cell infiltration. Scale bar = 200 μm. (D) The average thickness of cells infiltration in different groups (n=3). The significance was tested with one-way ANOVA with Tukey posthoc test (**p<0.01, ***p <0.001).
Abbreviations: p-sEV-AT, small extracellular vesicles derived from porcine adipose tissue; r-sEV-AT, small extracellular vesicles derived from rat adipose tissue; sEV-AT, small extracellular vesicles.
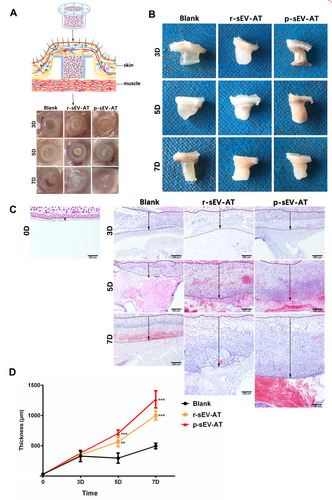
Figure 4 Neoadipose tissue formation induced by xenogeneic and allogeneic sEV-AT in vivo. Macro images of the implants (A) with the tubes or (B) without the tubes in the blank, r-sEV-AT and p-sEV-AT groups at 2W, 4W and 8W. The black arrows pointed out the blood vessels. (C) Immature and mature adipocytes were confirmed by immunohistochemical staining (stained with adipocyte marker, perilipin A). Scale bar = 200 μm. (D) Selected sections represented the center of the implants, the dotted line represented the area of neoadipose tissue (S1), the solid line represented the longitudinal section area of the silicone tube (S0), and S1/S0 represented the proportion of the neoadipose tissue in the silicone tube. (E) The average of S1/S0 in different groups (n=3). The significance was tested with one-way ANOVA with Tukey posthoc test (*p<0.05).
Abbreviations: p-sEV-AT, small extracellular vesicles derived from porcine adipose tissue; r-sEV-AT, small extracellular vesicles derived from rat adipose tissue; sEV-AT, small extracellular vesicles derived from adipose tissue.
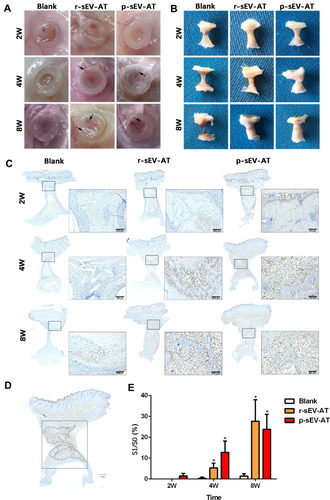
Figure 5 Skin wound healing accelerated by allogeneic and xenogeneic sEV-AT. (A) Macro images of skin wounds at 0D, 7D, 10D,14D and 21D. (B) From these images, wound edge traces were established for each time point. (C) Quantification of the wound area from 0D to 21D (n=3).
Abbreviations: p-sEV-AT, small extracellular vesicles derived from porcine adipose tissue; r-sEV-AT, small extracellular vesicles derived from rat adipose tissue; sEV-AT, small extracellular vesicles derived from adipose tissue.
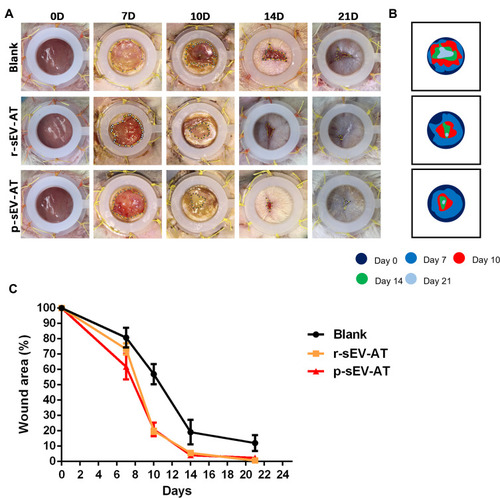
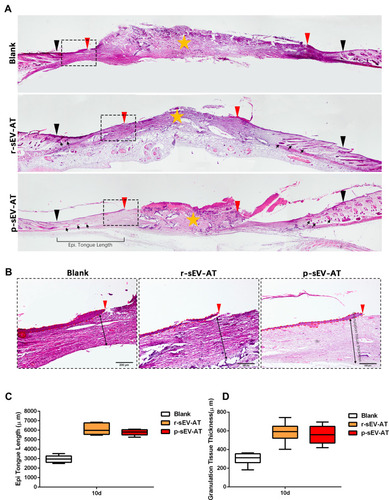
Figure 6 Skin wound healing in microstructure was improved by allogeneic and xenogeneic sEV-AT. (A) The microstructure of skin wounds at 10D was investigated by H&E staining. The black inverted triangles pointed out the original wound edges; the red inverted triangles pointed out the edge of re-epithelization; the black arrows pointed out the regenerated hair follicles; the orange star pointed out the disordered wound area. Magnified panels (B) the red inverted triangles pointed out the edge of re-epithelization; the dotted red lines pointed out the area of regenerated epithelium; the black two-way arrows pointed out the thickness of regularly arranged granulation tissue. Scale bar = 200 μm. (C) Quantification of the length of regenerated epidermal tongue at 10D. (D) Quantification of the thickness of granulation tissue at 10D (n=3).
Abbreviations: H&E, hematoxylin and eosin; p-sEV-AT, small extracellular vesicles derived from porcine adipose tissue; r-sEV-AT, small extracellular vesicles derived from rat adipose tissue; sEV-AT, small extracellular vesicles derived from adipose tissue.