Figures & data
Figure 1 SEM image of the freeze-dried TQ-PLGA NPs.
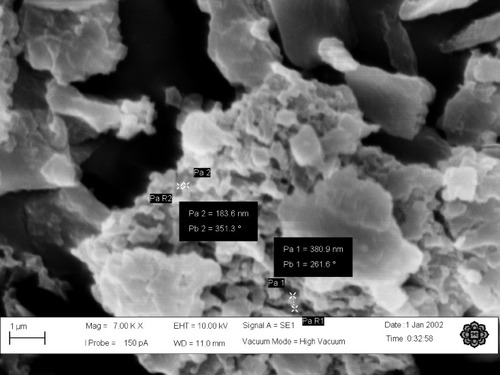
Figure 2 Release profile of the optimized TQ-PLGA NP formulation (Mean ± SE, n = 3). The release profile has two phases; burst release within 24 h followed by sustained release up to one week.
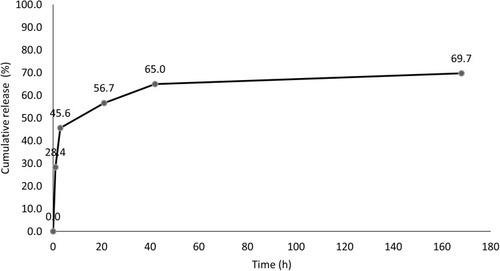
Figure 3 Stability of TQ-PLGA NP suspension at four different storage conditions. The stability indicators included (A) PS (particle size), (B) PDI (polydispersity index) and (C) ZP (zeta potential).
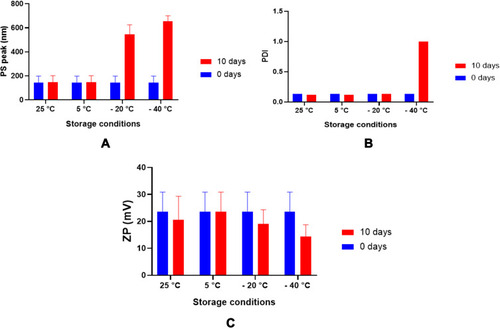
Figure 4 ATR-FTIR spectra of PLGA NPs, TQ-PLGA NPs, and TQ.
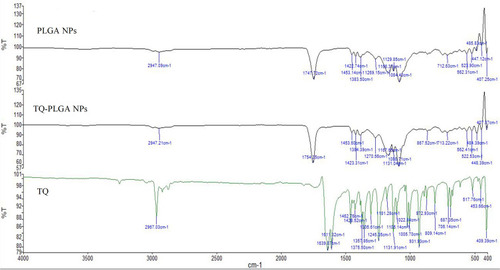
Figure 5 DSC thermograms of (A) TQ and the components in the NP formulation, physical mixture, and blank NPs and (B) TQ-PLGA NPs.
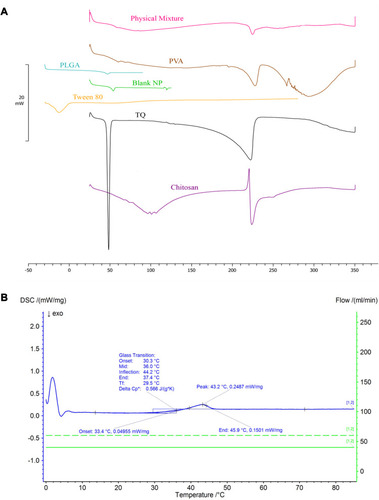
Figure 6 TQ-PLGA NP stability in DMEM media in term of polydispersity index (A), particle size (B), and zeta potential (C) incubated at 37ºC. The values are mean ± standard deviation, n=3, t-test of variance, *p-value ≤0.05, **p-value ≤0.001.
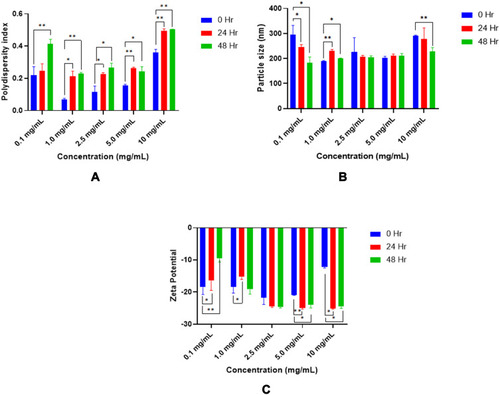
Figure 7 HPLC chromatograms demonstrating the stability of TQ in complete cell culture media at 0, 24 and 48 h incubation (37 °C).
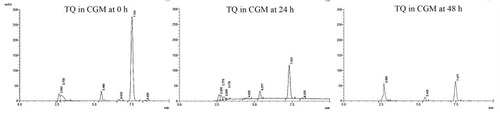
Figure 8 Flow cytometric analysis of the controls (A) free nanoparticles spiked in a media (positive control) and (B) untreated cells (negative control).
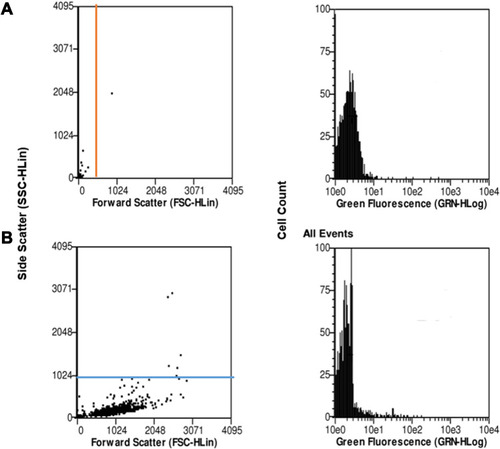
Figure 9 Flow cytometric analysis of A375 melanoma cells when incubated with coumarin-loaded nanoparticles in different concentration of nanoparticles suspension; (A) 0.1 mg/mL, (B) 1.0 mg/mL, (C) 2.5 mg/mL, (D) 5.0 mg/mL and (E) 10.0 mg/mL incubated for 24 h.
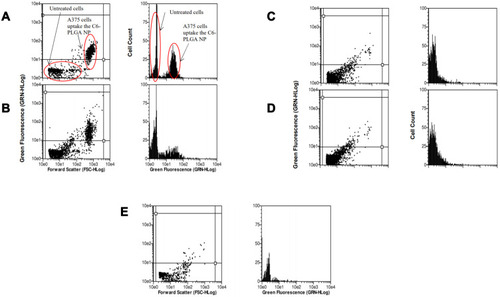
Figure 10 Flow cytometric analysis of A375 melanoma cells when incubated with coumarin-loaded nanoparticles treated with 1.0 mg/mL concentration of nanoparticles suspension at 3 different time points; (A) 2 h (B) 6 h, and (C) 24 h.
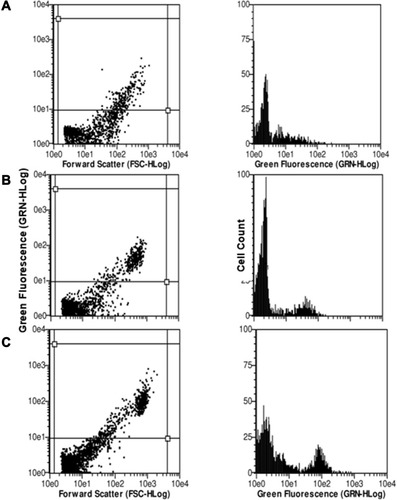
Figure 11 Cellular uptake mean fluorescence intensity (MFI) of coumarin-6 nanoparticles (C6-PLGA NPs) by A375 cell line at (A) different concentrations of nanoparticles and (B) three different times of incubation.
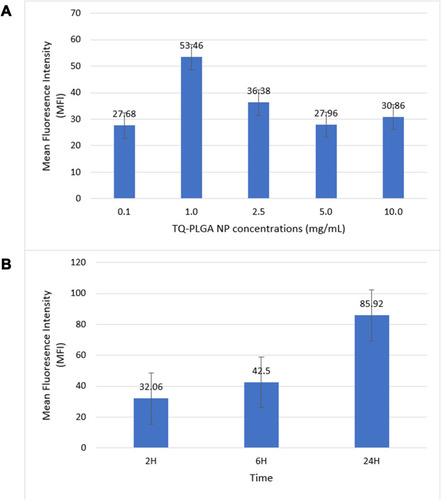
Figure 12 Cellular uptake of coumarin-6 nanoparticles (C6-PLGA NPs) by A375 cell line as seen under fluorescence microscope after immunofluorescent staining of the actin cytoskeleton and the nucleus of the cells using TRITC-conjugated phalloidin (red) and DAPI (blue) respectively; (A) 40X, (B) 100X magnifications.
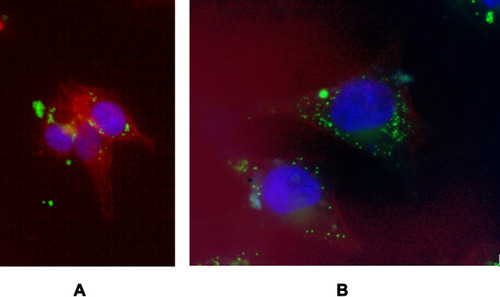
Figure 13 Cell viability of A375 cells treated with different concentrations of TQ solution for 24 h and 48 h.
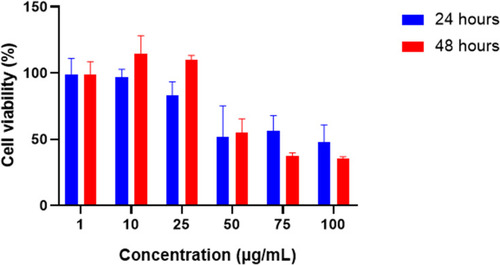
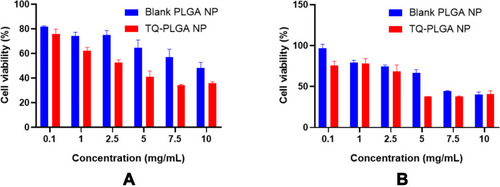
Figure 14 Cytotoxicity study (MTT assay) of blank nanoparticles and TQ-PLGA NPs in A375 human melanoma cancer cells. (A) 24 h and (B) 48 h.