Figures & data
Figure 1 Particle average size and size distribution of quercetin nanoliposomes. Image (A) and mean size (B) of quercetin nanoliposomes.
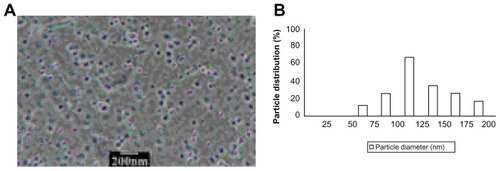
Figure 2 Effects of QUE-NL on cell morphology and percentage of viable C6 glioma cells. (A) Cells were examined and photographed by phase-contrast microscopy (200×) for percentage of viable cells. (B) Cells were cultured with various concentrations of QUE-NL for 12, 24, 36, and 48 hours.
Notes: Each point is mean ± standard deviation of three experiments. *P < 0.05; **P < 0.01; ***P < 0.001, significantly different from the control.
Abbreviations: QUE, quercetin; QUE-NL, nanoliposomes; DMSO, dimethylsulfoxide.
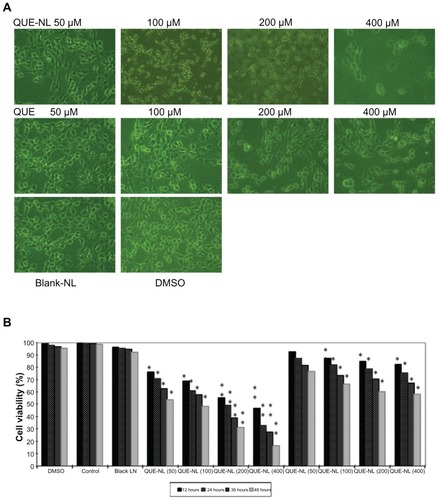
Figure 3 Apoptosis and necrosis in C6 glioma cells induced by QUE-NL. Cells were treated with the indicated concentration of nanoliposome of quercetin (QUE-NL) for 12 hours. (A) QUE-NL induces dose-dependent apoptosis and necrosis in C6 glioma cells. Cells were stained with Annexin V-FITC and analyzed by flow cytometry. (B) C6 glioma cells were treated with QUE for 12 hours. Cells were stained with Annexin V-FITC and analyzed by flow cytometry. (C) Control cells, including blank, DMSO, blank nanoliposome. (D) C6 glioma cells were stained with hematoxylin to detect the necrosis and cell apoptotic chromatin condensation. More than one field in each group were observed by fluorescence microscopy (400×), and representative images are shown. (E) Dose-dependent apoptosis and necrosis of C6 glioma cells by hematoxylin.
Notes: Representative measurements of at least three independent experiments are shown. The values of cell death (apoptosis and necrosis) reported represent the mean ± standard deviation of three separate experiments. *P < 0.05; **P < 0.01; ***P < 0.001 compared with control cells.
Abbreviations: DMSO, dimethylsulfoxide; NAC, N-acetylcysteine; QUE, quercetin; QUE-NL, nanoliposomes. Area of D2 means the normal mitochondrial membrane potential of C6 glioma cells, Area of D4 means the decreased mitochondrial membrane potential normal of C6 glioma cells.
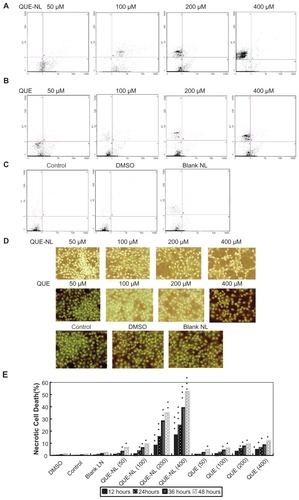
Figure 4 Necrosis of C6 glioma cells is involved in mediating ROS accumulation induced by QUE-NL. C6 glioma cells were treated with the indicated concentration of NL of quercetin (QUE-NL) for 12 hours in the presence or absence of NAC. Cells were loaded with DCFH-DA for 30 minutes. (A) ROS in C6 glioma cells treated with QUE-NL alone was estimated by flow cytometry analysis. (B) ROS in C6 glioma cells treated with NAC in combination with QUE-NL was estimated by flow cytometer analysis. (C and D) The DCF fluorescence was visualized using fluorescence microscope. (E) Cell death was measured as the percentage of propidium iodide-positive cells using flow cytometry. Significantly different from control, *P < 0.01. (F) Levels of ROS were measured using flow cytometry as described in the Methods section. Significantly different from control, *P < 0.01. (G) QUE-NL-induced mitochondrial membrane potential and mitochondrial dynamics regulated by QUE-NL. The mitochondrial membrane potential of cells was determined by retention of DiOC6(3) 40 μM added during the last 30 minutes of treatment. The amount of retained DiOC6(3) was measured by flow cytometry. (H) C6 glioma cells were respectively treated with the indicated concentrations of 200 μmol/L QUE-NL in the absence or presence of 200 μmol/L N-acetylcysteine for 12 hours. (I) C6 glioma cells were respectively treated with 200 μmol/L N-acetylcysteine alone for 12 hours. (J) QUE-NL-induced loss of mitochondrial membrane potential is inhibited with N-acetylcysteine. The alteration of mitochondrial membrane potential was analyzed by flow cytometer. The values reported represent the mean ± standard deviation of three separate experiments. *P < 0.01 compared with control cells. (K) ROS and ΔΨm levels in the presence or absence of QUE-NL treatment in C6 glioma cells for 12 hours by flow cytometric analysis; the cells were exposed to QUE-NL (200, 400 μM) for various intervals of time. The zero concentration was defined as the untreated control. The percentage of cells in ROS production and loss of ΔΨm were stained by specific dyes and determined by flow cytometry as described in the Methods section.
Notes: Values are means ± standard deviation (n = 3). Groups not sharing a same letter are significantly different to 0 hours by Student’s t-test (*P < 0.05; **P < 0.01 and ***P < 0.001).
Abbreviations: NAC, N-acetylcysteine; ROS, reactive oxygen species; QUE, quercetin; QUE-NL, nanoliposomes.
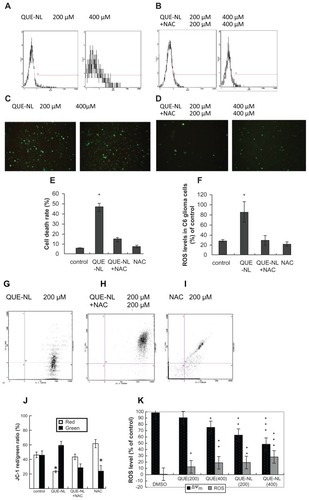
Figure 5 QUE-NL induced necrosis is associated with loss of mitochondrial membrane potential and the changes of ROS and cytochrome C release and caspase activation. (A) QUE-NL did not stimulate caspase-3 or caspase-9 activity compared with control cells. (B) QUE-NL-induced decrease of cytochrome C release and c QUE-NL did not promote the expression of caspase-3 or caspase-9 protein. The alteration of cytochrome C, caspase-3, caspase-9, and actin was analyzed by Western blotting.
Abbreviations: DMSO, dimethylsulfoxide; ROS, reactive oxygen species; QUE, quercetin; QUE-NL, nanoliposomes.
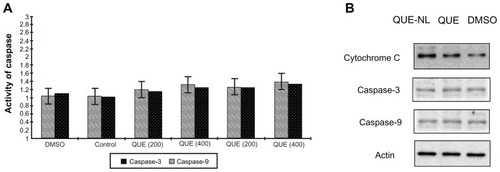
Figure 6 QUE-NL affected the levels of ATP and LDH release rate in C6 glioma cells. ATP detection assay and LDH activity-based cytotoxicity assays of C6 glioma cells treated with QUE-NL or QUE.
Notes: n = 3, mean ± standard deviation. **P < 0.01 versus control group; *P < 0.05 versus control group.
Abbreviations: LDH, lactate dehydrogenase; QUE, quercetin; QUE-NL, nanoliposomes.
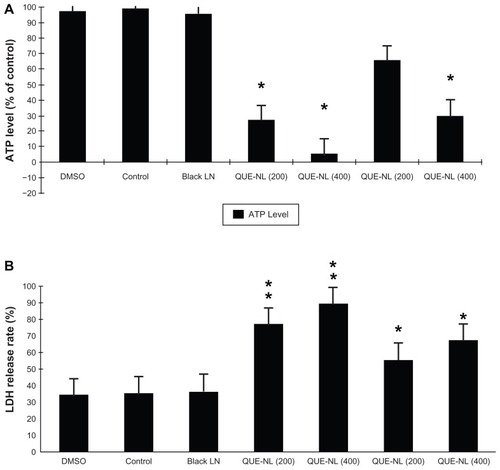
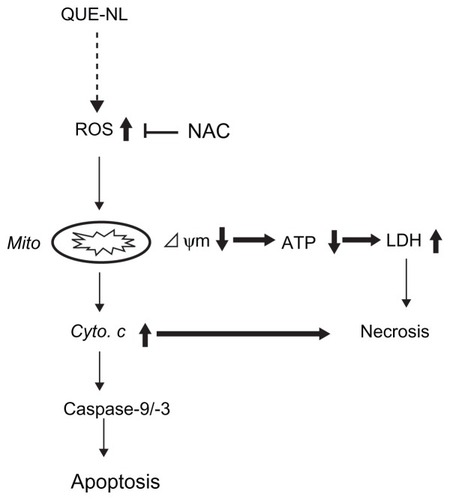
Figure 7 Diagram of mechanisms underlying the synergy between QUE-NL induced necrosis.
Abbreviations: LDH, lactate dehydrogenase; NAC, N-acetylcysteine; ROS, reactive oxygen species; QUE, quercetin; QUE-NL, nanoliposomes; ATP, adenosine triphosphate.