Figures & data
Figure 1 Graphical representation of a BA-loaded magnetoliposome. MIONPs*CA are incorporated in the aqueous core, while BA is entrapped in the lipid bilayer of the liposome. (Image realized by applying Servier Medical ART illustration: http://smart.servier.com).
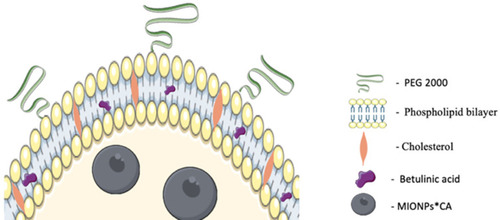
Figure 2 (A) Molecular structure and Micro-Raman spectra of betulinic acid (BA); (B) Micro-Raman spectra of magnetic iron oxide nanoparticles (MIONPs); (C) Micro-Raman spectra of BA-loaded magnetoliposomes.
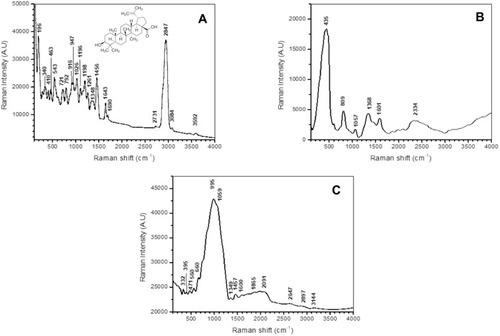
Figure 3 SEM-EDAX analysis of BA-loaded magnetoliposomes.
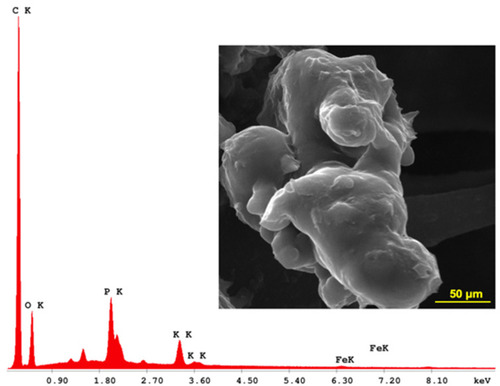
Table 1 Physico-Chemical Characteristics of BA-Loaded Magnetoliposomes and Controls
Figure 4 Graphical representation of: (A) intensity distribution of particles size of the liposomal samples; (B) magnetization curves of magnetoliposomes and control (MIONPs); (C) TG/DSC curves of BA-loaded magnetoliposome.
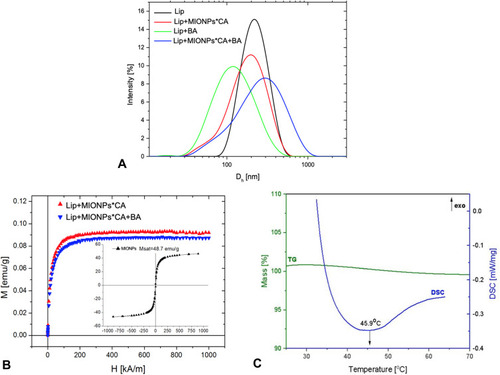
Figure 5 Viability percentages of breast adenocarcinoma (MDA-MB-231, MCF7) cells and breast epithelial (MCF 10A) cells after exposure to liposomal structures at concentrations of 5 and 25 µM. The MTT assessment was performed 24h post-stimulation, under normothermic (37 °C) and hyperthermic (43 °C) conditions. The cell viability percentage was normalized to control cells (no stimulation, under normothermic conditions). One-way ANOVA analysis was applied to determine the statistical differences followed by Tukey’s multiple comparisons test vs hyperthermia control (*p < 0.05; **p < 0.01; ***p < 0.001, ****p < 0.0001). The data represent the mean values ± SD of three independent experiments (n=3).
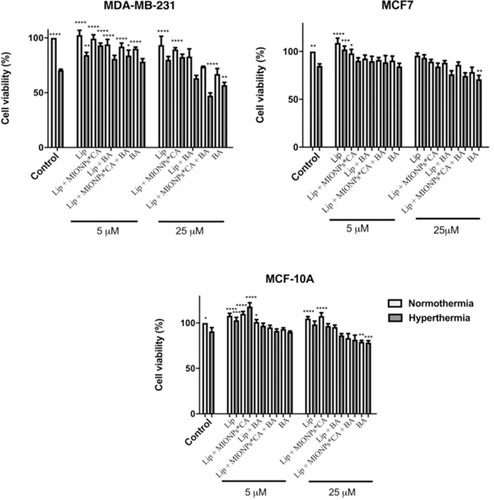
Figure 6 Cytotoxicity percentages of breast adenocarcinoma (MDA-MB-231, MCF7) cells and breast epithelial (MCF 10A) cells after exposure to liposomal structures at concentration of 25 µM. The LDH assessment was performed 24 h post-stimulation under normothermic (37 °C) and hyperthermic (43 °C) conditions. One-way ANOVA analysis was applied to determine the statistical differences followed by Tukey’s multiple comparisons test vs hyperthermia control (*p < 0.05; **p < 0.01; ***p < 0.001, ****p < 0.0001). The data represent the mean values ± SD of three independent experiments (n=3).
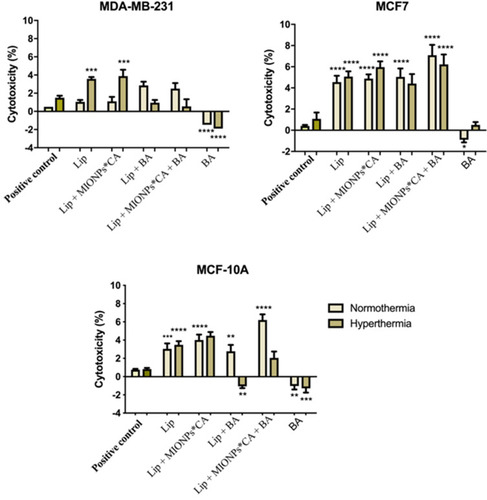
Figure 7 Representative images of the migratory capacity of the breast adenocarcinoma (MDA-MB-231, MCF7) cells and breast epithelial (MCF 10A) cells after treatment with test compounds at concentration of 25 µM. The results were expressed as percentage of wound closure after 24 h (normothermia/hyperthermia) compared to the initial surface; NT – normothermia (37 °C), HT – hyperthermia (43 °C). The cells were visualized by light microscopy, at magnification 20x. Scale bars represent 50 µm. One-way ANOVA analysis was applied to determine the statistical differences followed by Tukey’s multiple comparisons test vs hyperthermia control (*p < 0.05; **p < 0.01; ***p < 0.001, ****p < 0.0001). The data represent the mean values ± SD of three independent experiments (n=3).
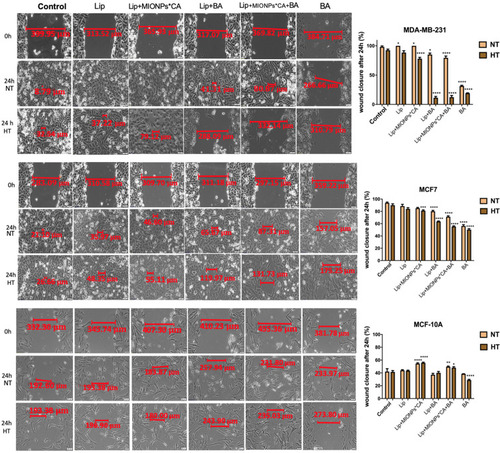
Figure 8 MDA-MB-231 cells visualized by fluorescence microscopy, after 24 h treatment with test compounds at concentration of 25 µM, under hyperthermal conditions. Nuclear and microtubules staining were expressed separately (DAPI and α-tubulin, respectively) and also combined (overlay). Yellow arrows marked the typical morphological changes for apoptosis induction: chromatin condensation, boundary alterations, and nuclear fragmentation, while enucleation process is highlighted by the yellow circle. The abnormal filamentous organization of microtubule (MT) network was indicated by the red arrows. Three independent experiments were performed for each sample (n=3).
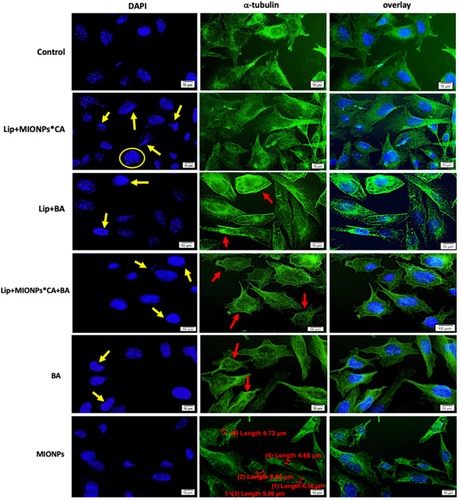
Figure 9 MCF7 cells visualized by fluorescence microscopy, after 24 h treatment with test compounds at concentration of 25 µM under hyperthermal conditions. Nuclear and microtubules staining were expressed separately (DAPI and α-tubulin, respectively) and also combined (overlay). Yellow arrows marked the typical morphological changes for apoptosis induction: chromatin condensation, boundary alterations, and nuclear fragmentation, while enucleation process is highlighted by the yellow circle. The abnormal filamentous organization of microtubule (MT) network was indicated by the red arrows. Three independent experiments were performed for each sample (n=3).
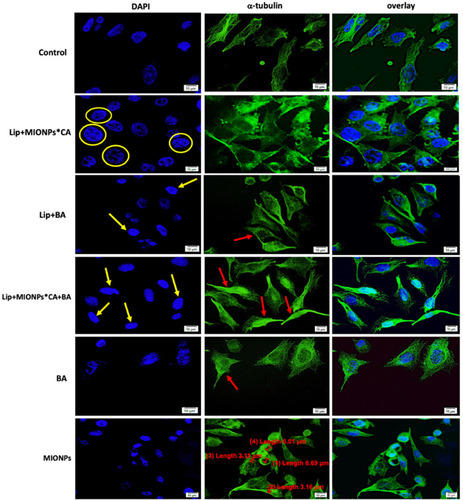
Figure 10 Stereomicroscopic in ovo images of the vascularized areas treated with blank liposomal samples (Lip and Lip+MIONPs*CA) at concentration of 25 µM, under normothermic – NT (37 °C) and hyperthermic pre-treatment – HT (46 °C). Three independent experiments were performed for each sample (n=3).
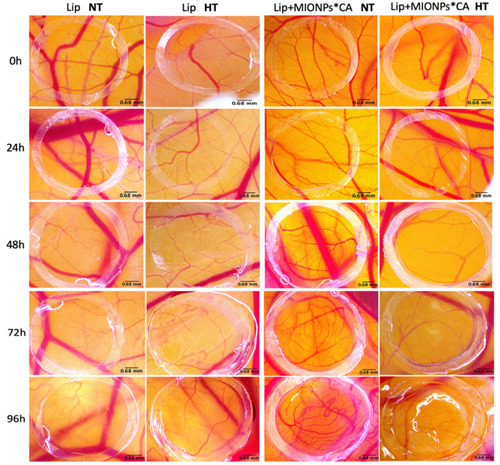
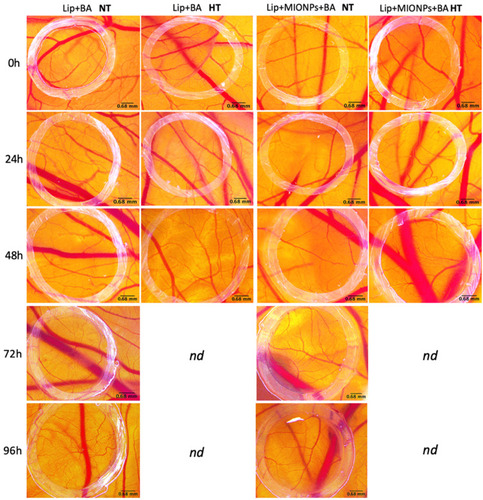
Figure 11 Stereomicroscopic in vivo images of the vascularized areas treated with liposomal samples containing BA (Lip+BA and Lip+MIONPs*CA+BA) at concentration of 25 µM, under normothermic - NT (37 °C) and hyperthermic pre-treatment - HT (46 °C). The specimens with hyperthermic pre-treatment died after 48h, so they were not determined (nd) further. Three independent experiments were performed for each sample (n=3).