Figures & data
Scheme 1 The synthesis of control (Gd[III]-DOTA-G5) and FA targeted dendritic chelate (Gd[III]-DOTA-G5-FA). After conjugation of 4.5 (on average) of folic acid molecules to G5 PAMAM dendrimer (a), 50 of the primary amine groups were acetylated (b), the remaining primary amines conjugated with bifunctional NCS-DOTA (c) and complexed with GdCl3.6H2O (d). The structure of the DOTA-NCS used for conjugation of contrast agents (lower panel).
![Scheme 1 The synthesis of control (Gd[III]-DOTA-G5) and FA targeted dendritic chelate (Gd[III]-DOTA-G5-FA). After conjugation of 4.5 (on average) of folic acid molecules to G5 PAMAM dendrimer (a), 50 of the primary amine groups were acetylated (b), the remaining primary amines conjugated with bifunctional NCS-DOTA (c) and complexed with GdCl3.6H2O (d). The structure of the DOTA-NCS used for conjugation of contrast agents (lower panel).](/cms/asset/e9c350a4-bd52-4b3f-8b58-83170ab51239/dijn_a_2696_f0001_b.jpg)
Table 1 Relaxation rates (R1) ± estimated error of inversion recovery fit of KB cells labeled with non-targeted and targeted (FA) Gd loaded G5 dendrimers, both at adjusted 0.01 mM concentration of Gd, were measured in wet cell pellets. Increased relaxation rate of cells labeled with the targeted contrast agent indicates specific binding to KB cells. Cell pellets were created with 5 × 10⁶ cells and had an approximate volume of 100 μL. All relaxation rates were measured at 2T and at 20°C
Figure 1 MR imaged uptake of targeted and non-targeted contrast nanoparticles delivered at 0.029 mmol/kg of Gd. The top image is of a control mouse injected with saline and imaged at 1hour (a). The series of images on the left from the mouse injected with targeted contrast Gd(III)-DOTA-G5-FA and on the right from the mouse injected with the non-targeted contrast agent Gd(III)-DOTA-G5 were collected at 1, 4, 24, and 48 hours post-injection (a). The circles are drawn around the tumor to guide the eye. Signal enhancement is created by increased water proton relaxation due to the presence of the contrast agent. Normalized histograms of the voxel intensities were created for the whole tumors on both flanks of mouse, for the two mice injected with targeted and non-targeted contrast presented on the series of images (a). Comparison of targeted (b) and non-targeted contrast (c) showed statistically significant difference (; KS test, p < 0.05) between the signals collected at 1, 4, and 24 hours.
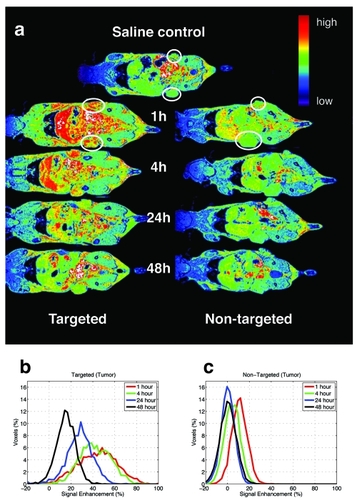
Table 2 P values of KS test between normalized histograms of signal intensities of the MR data from Gd(III)-DOTA-G5-FA and Gd(III)-DOTA-G5 contrast agents in tumors shown in . Histograms at 1, 4, and 24 hours show a statistically significant difference. P values of less than 0.05 allow us to reject the null hypothesis that the two samples are drawn from the same underlying population
Figure 2 Signal enhancement in tumor (a), kidney (b), liver (c) and, muscle (d) in the two mice injected with targeted [Gd(III)-DOTA-G5-FA] or non-targeted [Gd(III)-DOTA-G5] contrast presented in . A significant difference between signal enhancement of the two contrast agents is observed at 1, 4, and 24 hours for the tumor (a) and at 1 and 4 hours for the kidney (b) and the liver (c) indicating preferential uptake of targeted contrast agent. Signal in muscle shows no enhancement for either contrast agent (d).
![Figure 2 Signal enhancement in tumor (a), kidney (b), liver (c) and, muscle (d) in the two mice injected with targeted [Gd(III)-DOTA-G5-FA] or non-targeted [Gd(III)-DOTA-G5] contrast presented in Figure 1a. A significant difference between signal enhancement of the two contrast agents is observed at 1, 4, and 24 hours for the tumor (a) and at 1 and 4 hours for the kidney (b) and the liver (c) indicating preferential uptake of targeted contrast agent. Signal in muscle shows no enhancement for either contrast agent (d).](/cms/asset/cf260583-f66a-4382-90fb-ad982f035d3e/dijn_a_2696_f0003_b.jpg)
Figure 3 MR images obtained at a higher dose of Gd (0.072 mmol/kg) of targeted Gd(III)-DOTA-G5-FA and non-targeted Gd(III)-DOTA-G5 contrast nanoparticles (a). A significant difference in the signal intensity is observed at 4 hours (b) and from 1 to 24 hours post-injection of contrast nanoparticles (c, d). The signal persists up to 48 hours post-injection (c) with a minimal overlap between targeted and non-targeted contrast agents up to 24 hours (c, d).
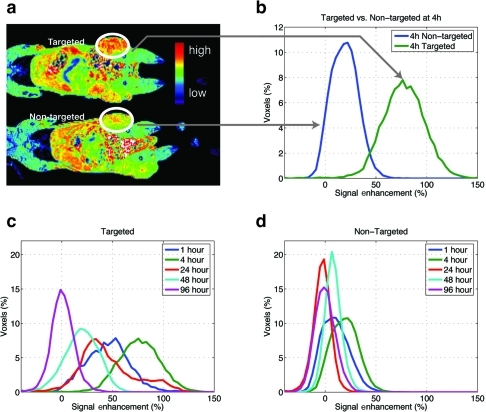
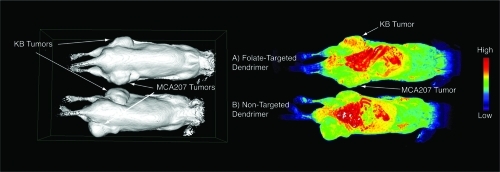
Figure 4 Surface rendering (left panel) and signal enhancement images (right panel) of the same pair of mice bearing KB tumors (upper flank of mouse) and MCA207 tumors (lower flank of mouse) injected with folate-targeted contrast nanoparticle (A) and non-targeted contrast nanoparticle (B). The KB tumor that expresses FAR showed signal enhancement at 24 hours post-injection of targeted-contrast (right panel, A, upper flank) compared with some capture in MCA207 tumor, which was non-specific for both targeted and non-targeted contrast nanoparticles.