Figures & data
Table 1 Levels of the Independent Variables in Box-Behnken Statistical Design and the Optimization Criteria of the Dependent Variables
Table 2 Different Runs’ Composition Corresponding to Box-Behnken Design with Their Resultant Dependent Variables (n=3)
Table 3 Levels of the Independent Variables in D-Optimal Statistical Design and the Optimization Criteria of the Dependent Variables
Table 4 Different Runs’ Composition Corresponding to D-Optimal Design with Their Resultant Dependent Variables (n=3)
Table 5 Primers Used for qRT-PCR
Figure 1 Pareto chart showing the standardized effect of independent variables on (A) PS, (B) ZP, (C) EE% of GA-ANCNPs.
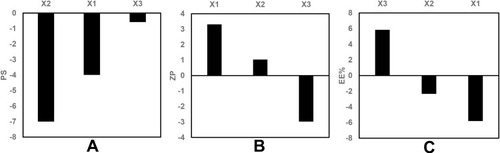
Figure 2 Response surface plots for the effects of drug loading and phospholipid: zein ratio on (A) ZP and (B) EE% of GA-ANCNPs.
Abbreviations: ZP, Zeta potential; EE%, Entrapment efficiency percentage; GA, Gallic acid; ANCNP, Anionic zein/phospholipid composite nanoparticles.
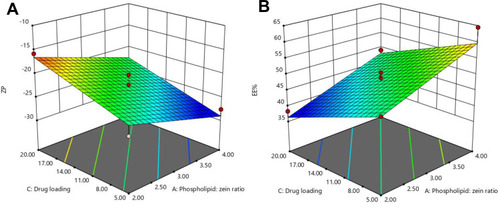
Figure 3 Pareto chart showing the standardized effect of independent variables and their interactions on (A) PS, (B) ZP, (C) EE% of GA-CACNPs.
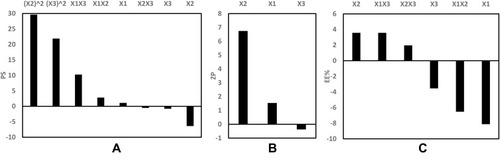
Figure 4 (A) Response surface plot for the effects of amount of positive charge inducer and sonication time on ZP, Line plots for (B) the main effect of type of positive charge inducer (SA and DDAB) on EE%, (C) the interaction between type of positive charge inducer and sonication time on PS and (D) the interaction between type and amount of positive charge inducer on EE% of GA-CACNPs.
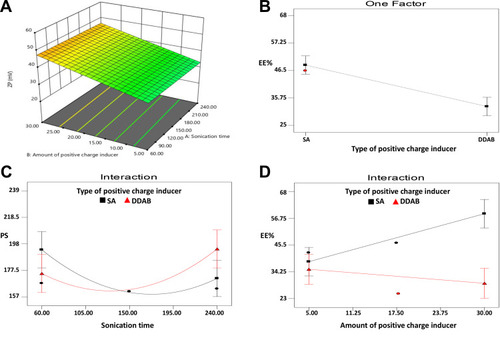
Figure 5 Transmission electron micrographs of (A) optimized GA-ANCNP, (B) optimized GA-CACNP and (C) GA-CACNP/VA (bar = 100 nm, magnification power= 60000X).
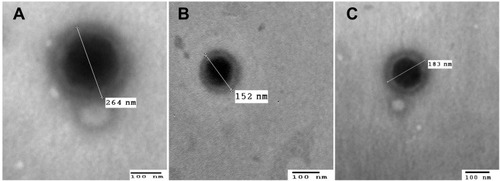
Figure 6 In vitro release profiles of GA from different systems relative to GA solution in phosphate buffer (pH 6.8). Results are expressed as means ± SD, n=3.
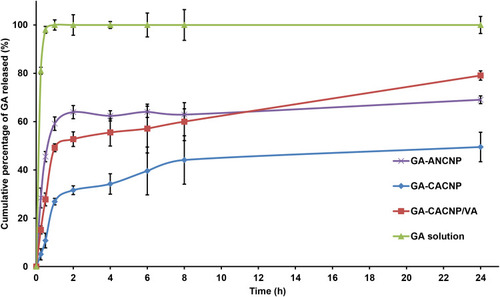
Figure 7 FTIR spectra of (A) VA, (B) optimized GA-CACNP system and (C) GA-CACNP/VA system.
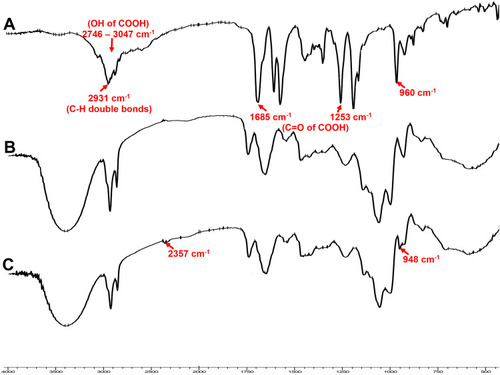
Figure 8 DSC thermograms of GA, zein, phospholipid, SA, VA, sucrose, physical mixture, and GA-CACNP/VA system.
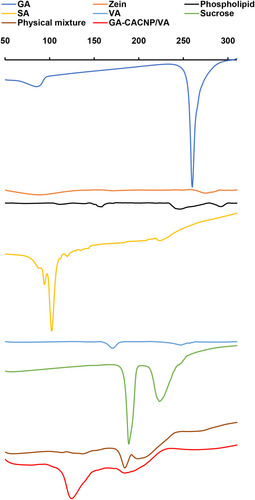
Figure 9 Effect of GA-CNPs on cellular uptake and cytotoxicity activities in aHSCs; (A) microscopic fluorescent image showing aHSCs uptake of Rhodamine-loaded-CNP, (B, C) cytotoxicity/antiproliferative activity of the free GA and GA-CNPs against (B) aHSCs and (C) primary hepatocytes after 48 h exposure. Each experiment is performed in triplicate (n=3).
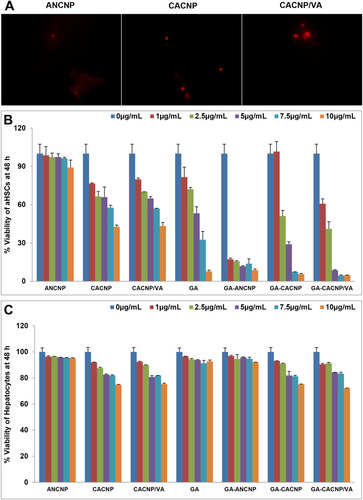
Figure 10 Antifibrogenic effects of GA-CNPs on fibrosis markers in aHSCs; (A&B) Representative graphs showing mRNA expression levels of activation [(A) TGF-β1 and (B) α-SMA] in aHSCs; (C) representative images of migration of aHSCs at 0 and 48 h treated with medium, plain CNPs,free GA, and GA-CNPs (x40 magnification); (D) representative graph showing the percentage of wound closure after 48 h; (E&F) representative graphs showing mRNA expression levels of (E) collagen synthesis (COL1A1) and (F) apoptosis (Caspase-3) markers in aHSCs; (G) representative fluorescent photomicrographs showing nuclear morphological changes of apoptotic nuclei (red arrows) in DAPI stained aHSC-T6 treated with medium, plain CNPs, free GA and GA-CNPs. Results are expressed as mean ± SD of three independent experiments, (n=3). ap < 0.05 vs control untreated aHSCs; bp < 0.05 vs GA-treated aHSCs; cp < 0.05 vs GA-ANCNP; dp < 0.05 vs GA-CACNP.
![Figure 10 Antifibrogenic effects of GA-CNPs on fibrosis markers in aHSCs; (A&B) Representative graphs showing mRNA expression levels of activation [(A) TGF-β1 and (B) α-SMA] in aHSCs; (C) representative images of migration of aHSCs at 0 and 48 h treated with medium, plain CNPs,free GA, and GA-CNPs (x40 magnification); (D) representative graph showing the percentage of wound closure after 48 h; (E&F) representative graphs showing mRNA expression levels of (E) collagen synthesis (COL1A1) and (F) apoptosis (Caspase-3) markers in aHSCs; (G) representative fluorescent photomicrographs showing nuclear morphological changes of apoptotic nuclei (red arrows) in DAPI stained aHSC-T6 treated with medium, plain CNPs, free GA and GA-CNPs. Results are expressed as mean ± SD of three independent experiments, (n=3). ap < 0.05 vs control untreated aHSCs; bp < 0.05 vs GA-treated aHSCs; cp < 0.05 vs GA-ANCNP; dp < 0.05 vs GA-CACNP.](/cms/asset/59ff327d-6d56-4fc6-a459-7cbd1fbab071/dijn_a_12194843_f0010_c.jpg)
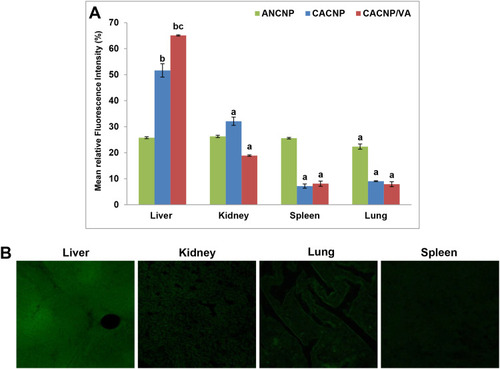
Figure 11 In vivo biodistribution of Rhodamine B-labelled-CNPs in vital organs; (A) representative graphs showing mean fluorescence intensity percentages of vital organs after treatment with Rhodamine B loaded-CNPs. Results are expressed as means ± SD, (n=3); (B) photomicrographs showing confocal laser scanning of vital organs treated with Rhodamine B-loaded-CACNP/VA. ap < 0.05 denotes statistically significant difference between organs vs liver within the same formula; bp < 0.05 vs Rhodamine B-loaded-ANCNP within liver; cp < 0.05 vs Rhodamine B-loaded-CACNP within liver.