Figures & data
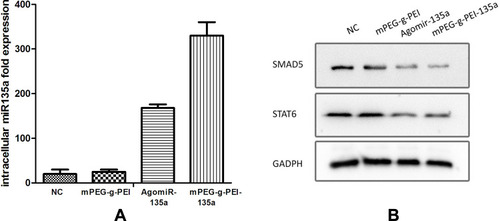
Figure 6 (A) Analysis of miR-135a expression by RT-PCR in different groups (*P<0.05). (B) Western blot analysis of the expression of SMAD5 and STAT6 levels in the C6 glioma model of different groups.
Abbreviations: RT-PCR, real-time polymerase chain reaction; mPEG -g-PEI, polyethylene glycol methyl ether grafted polyethylenimine; NC, negative control.