Figures & data
Table 1 Characteristics of Pluronic® block copolymers
Figure 1 Synthetic scheme of Pluronic®-g-polyethylenimine (Pluronic-g-PEI).
Abbreviation: LMW, low-molecular-weight.
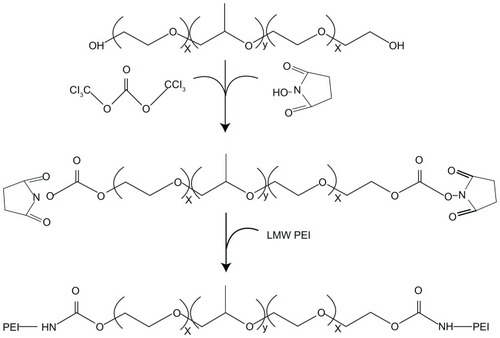
Figure 2 Representative proton nuclear magnetic resonance spectra (300 MHz) of the –CH2CH2O– proton in Pluronic® F68 at about δ3.8 ppm (A) and the –CH2CH2NHrepeating unit of polyethylenimine in F68-polyethylenimine 2KD at δ2.7–3.5 ppm (B) in deuterium oxide.

Figure 3 Agarose gel electrophoresis of complexes at various weight-to-weight (polymer particle/DNA) ratios: (A) F68-polyethylenimine (F68-PEI) 2KD, (B) P105-PEI 2KD, (C) P123-PEI 2KD, (D) L61-PEI 2KD, and (E) PEI 2KD.
Note: The used plasmid DNA was 0.1 μg, and copolymer/DNA complexes were prepared in phosphate-buffered saline.
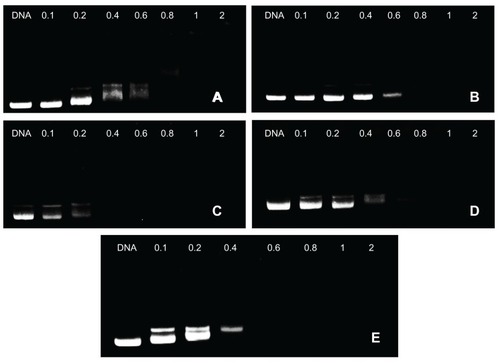
Figure 4 The influence of dithiothreitol (DTT) on P105-polyethylenimine 2KD/DNA complexes: other than the later three being treated with DDT 10 mmol/L, the two groups of P105-polyethylenimine 2KD/DNA complexes were identical.
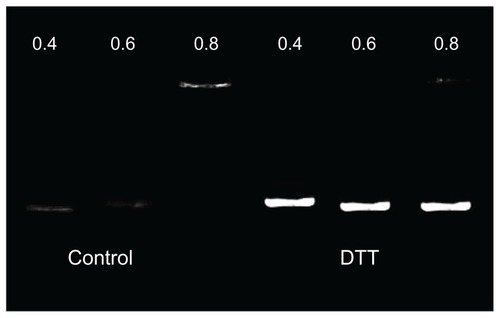
Figure 5 Degradation of polymer particles – copolymers were dissolved in phosphate-buffered saline (0.1 mol/L, pH 7.4), and were incubated at 37°C with shaking at 100 rpm.
Notes: The same experiment was repeated three times for statistical analysis. Determination of molecular weight was measured by gel permeation chromatography with multi-angle laser light scattering (n = 3).
Abbreviation: PEI, polyethylenimine.
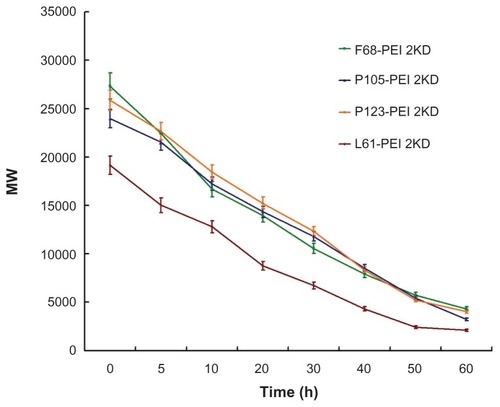
Figure 6 The ability of anti-DNase of P123-polyethylenimine (P123-PEI) could protect the DNA out of DNase. Lane 1: naked plasmid DNA treated with DNase; Lane 2: polymer particle/DNA complexes treated with DNase and then with sodium dodecyl sulfate (SDS); Lane 3: polymer particle/DNA complexes as control.
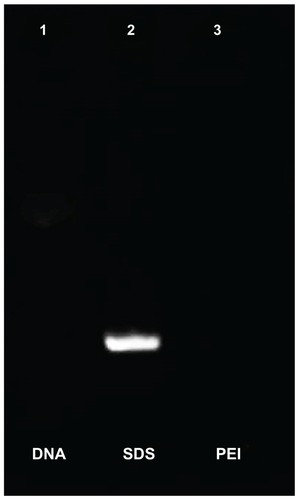
Figure 7 Particle sizes of polymer particle/DNA complexes, with polyethylenimine (PEI)/DNA as control.
Notes: The same experiment was repeated three times for statistical analysis. Data expressed as mean values (plus or minus standard deviation, n = 3).
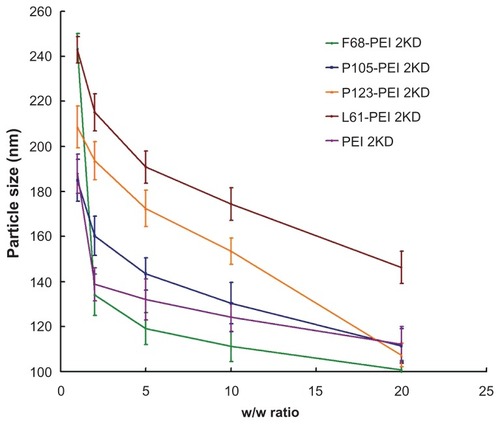
Figure 8 Zeta potential of polymer particle/DNA complexes, with polyethylenimine (PEI)/DNA as control.
Notes: The same experiment was repeated three times for statistical analysis. Data expressed as mean values (plus or minus standard deviation, n = 3).
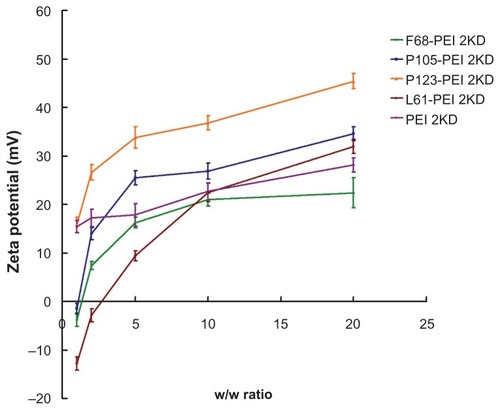
Figure 9 Cytotoxicity of polymer particles at various concentrations in HeLa cell lines by Cell Counting Kit-8 assay (CCK-8, Dojindo, Japan).
Notes: The same experiment was repeated six times for statistical analysis. Each data point represents the mean plus or minus the standard deviation (n = 6, **P < 0.01).
Abbreviation: PEI, polyethylenimine.
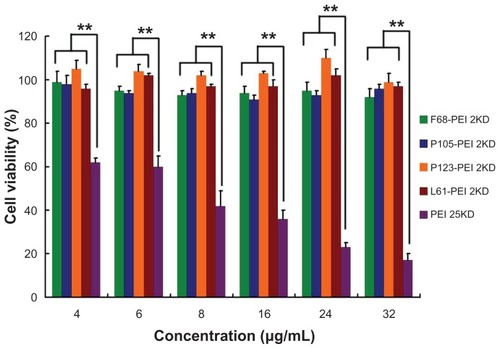
Figure 10 Transfection efficiency of different polymer particle/DNA complexes at the HeLa cell line.
Notes: The same experiment was repeated six times for statistical analysis. Each data point represents the mean plus or minus the standard deviation (n = 6, **P < 0.01).
Abbreviations: PEI, polyethylenimine; RLU, relative light unit.
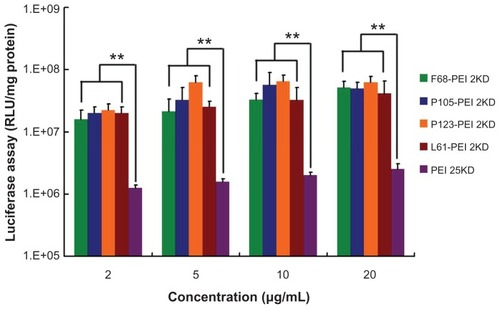
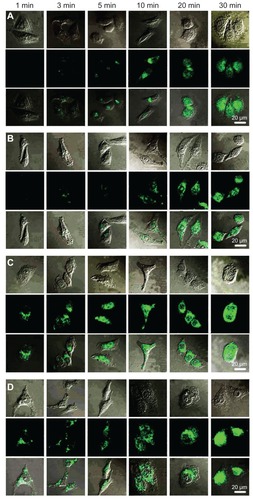
Figure 11 Cellular trafficking of (A) F68-polyethylenimine (F68-PEI) 2K, (B) P105-PEI 2K, (C) P123-PEI 2K, and (D) L61-PEI 2K analyzed by confocal microscopy in HeLa cells.
Notes: The first line of each group shows the respective transmitted light image, the second line shows the fluorescence micrographs of the same field, and the images in the third line are the merged pictures. Micrographs obtained at magnification 400×.