Figures & data
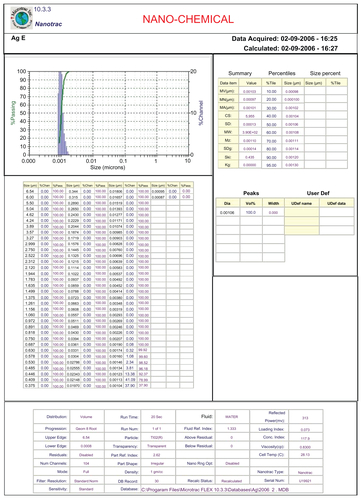
Table 1 Physicochemical characteristics of silver nanoparticles
Figure 1 Effect of silver NPs on bronchial inflammation in ovalbumin-sensitized and ovalbumin-challenged mice. Sampling was performed 48 hours after the final challenge in saline-inhaled mice administered saline (SAL), saline-inhaled mice administered 40 mg/kg of silver NPs (Ag40) or SU5614 (SU5614), ovalbumin-inhaled mice administered saline (OVA), and ovalbumin-inhaled mice administered 40 mg/kg of silver NPs (OVA+Ag40) or SU5614 (OVA+SU5614). (A) The number of total and differential cellular components of BAL fluids. Bars indicate the mean ± standard error of the mean for eight mice per group in four to six independent experiments. (B–G) Representative of H&E-stained sections of the lungs.
Notes: *P < 0.05 versus OVA; #P < 0.05 versus SAL. Bars indicate scale of 50 μm.
Abbreviations: BAL, bronchoalveolar lavage; H&E, hematoxylin and eosin; NP, nanoparticle.
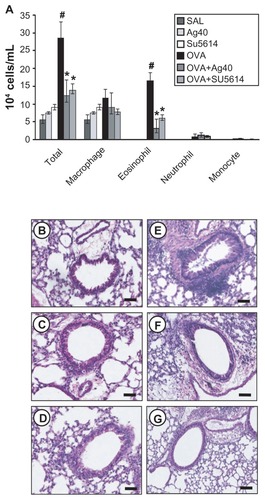
Figure 2 Effect of silver NPs on IL-4, IL-5, and IL-13 expression in lung tissues collected from ovalbumin-sensitized and ovalbumin-challenged mice. Sampling was performed 48 hours after the final challenge in saline-inhaled mice administered saline (SAL), saline-inhaled mice administered 40 mg/kg of silver NPs (Ag40) or SU5614 (SU5614), ovalbumin-inhaled mice administered saline (OVA), and ovalbumin-inhaled mice administered 40 mg/kg of silver NPs (OVA+Ag40) or SU5614 (OVA+SU5614). (A) Western blot analyses of IL-4, IL-5, and IL-13 in lung tissues. (B) Quantification of the IL-4, IL-5, and IL-13 protein levels in (A) using Gel-Pro Analyzer. Bars indicate the mean ± standard error of the mean and are representative of eight independent experiments using different preparations of lung tissues.
Notes: The relative protein content was calculated as the ratio of the integrated optical density of each protein to that of actin. *P < 0.05 versus OVA; #P < 0.05 versus SAL.
Abbreviations: IL, interleukin; NP, nanoparticle.
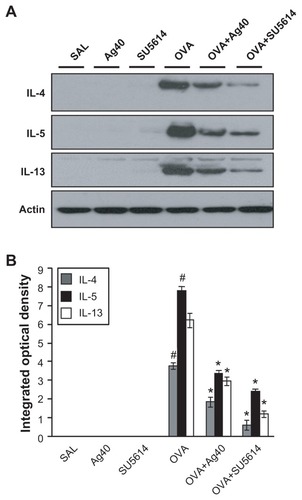
Figure 3 Effect of silver NPs on the protein expression of HIF-1α and VEGF in lung tissues collected from ovalbumin-sensitized and ovalbumin-challenged mice. HIF-1α or VEGF was measured 48 hours after the final challenge in saline-inhaled mice administered saline (SAL), saline-inhaled mice administered 40 mg/kg of silver NPs (Ag40) or SU5614 (SU5614), ovalbumin-inhaled mice administered saline (OVA), and ovalbumin-inhaled mice administered 40 mg/kg of silver NPs (OVA+Ag40) or SU5614 (OVA+SU5614). (A) Western blot analyses of HIF-1α and HIF-1β from lung tissues. (B) Western blot analyses of VEGF from lung tissues. (C) HIF-1α and VEGF protein levels in A and B, respectively, were quantified using a Gel-Pro Analyzer and plotted as the integrated optical density, using Microsoft Excel. Densitometric analyses are presented as the relative ratio of each molecule to HIF-1β or actin.
Notes: Bars indicate the mean ± standard error of the mean and are representative of eight independent experiments using different preparations of total lung extracts.
*P < 0.05 versus OVA; #P < 0.05 versus SAL.
Abbreviations: HIF, hypoxia-inducible factor; NP, nanoparticle; VEGF, vascular endothelial growth factor.
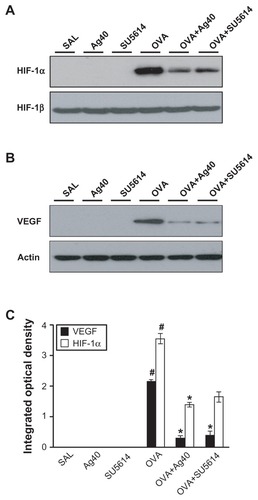
Figure 4 Effect of silver NPs on the protein expression of PI3K and Akt levels in lung tissues collected from ovalbumin-sensitized and ovalbumin-challenged mice. PI3K or Akt was measured 48 hours after the final challenge in saline-inhaled mice administered saline (SAL), saline-inhaled mice administered 40 mg/kg of silver NPs (Ag40) or SU5614 (SU5614), ovalbumin-inhaled mice administered saline (OVA), and ovalbumin-inhaled mice administered 40 mg/kg of silver NPs (OVA+Ag40) or SU5614 (OVA+SU5614). (A) Western blot analyses of PI3K from lung tissues. (B) Western blot analyses of phosphorylated-Akt protein levels from lung tissues. (C) phosphorylated-Akt levels were quantified using a Gel-Pro Analyzer and plotted as the integrated optical density, using Microsoft Excel. Densitometric analyses are presented as the relative ratio of each molecule to total Akt.
Notes: Bars indicate the mean ± standard error of the mean and are representative of eight independent experiments using different preparations of total lung extracts.
*P < 0.05 versus OVA; #P < 0.05 versus SAL.
Abbreviations: NP, nanoparticle; p-AKT, phosphorylated-Akt; PI3K, phosphatidylinositol-3 kinase; T-AKT, total Akt.
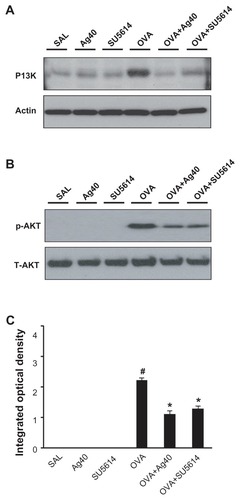
Figure 5 Dose-dependent effect of silver NPs and effect of SU5614 on PI3K, HIF-1α, and VEGF levels in HUVECs. Expression of PI3K, HIF-1α, or VEGF protein was examined by immunoblot analysis. Starved cells were treated with 10, 20, 50, 100, 200, or 500 μM silver NPs or SU5614 for 48 hours. Blots were stripped and reprobed for actin as a loading contol.
Abbreviations: CONT, control; HIF, hypoxia-inducible factor; NP, nanoparticle; PI3K, phosphatidylinositol-3 kinase; VEGF, vascular endothelial growth factor.
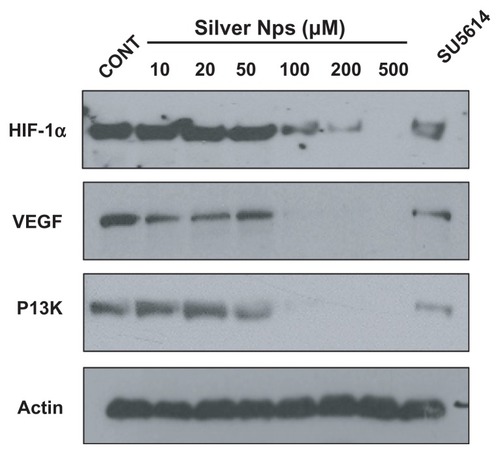
Figure 6 Effect of silver NPs and SU5614 on mucus production in OVA-sensitized and OVA-challenged mice. Histological examination was obtained from lung tissue 48 hours after the final challenge in saline-inhaled mice administered saline (A), saline-inhaled mice administered 40 mg/kg of silver NPs (B), or SU5614 (C), OVA-inhaled mice administered saline (D), OVA-inhaled mice administered 40 mg/kg of silver NPs (E), or SU5614 (F). Paraffin section slide of lung tissues were stained periodic acid-schiff stain.
Notes: All stained slides were evaluated via light microscopy under identical conditions with respect to magnification (20×), gain, camera position, and background illumination. Bars indicate 50 μm.
Abbreviations: NP, nanoparticle; OVA, ovalbumin.
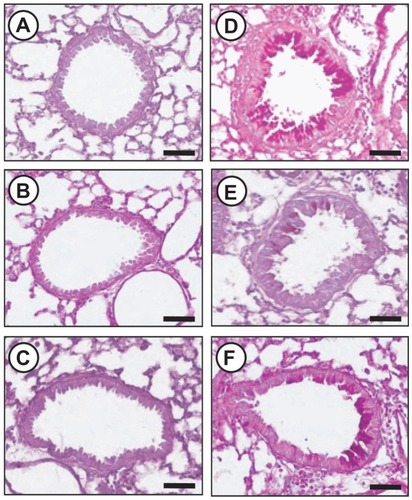
Figure 7 Effect of silver NPs and SU5614 on the protein expression of Muc5ac in lung tissues collected from ovalbumin-sensitized and ovalbumin-challenged mice. (A) Western blot analyses of Muc5ac in total protein extracts from lung tissues. (B–G) Localization of immunoreactive Muc5ac in the bronchiolar epithelial layer. Muc5ac was measured 48 hours after the final challenge in saline-inhaled mice administered saline (SAL or B), saline-inhaled mice administered silver NPs (Ag40 or C), saline-inhaled mice administered SU5614 (SU5614 or D), ovalbumin-inhaled mice administered saline (OVA or E), ovalbumin-inhaled mice administered silver NPs (OVA+Ag40 or F), and ovalbumin-inhaled mice administered SU5614 (OVA+SU5614 or G).
Notes: Brown color indicates Muc5ac-positive cells. Bars indicate 50 μm.
Abbreviation: NP, nanoparticle.
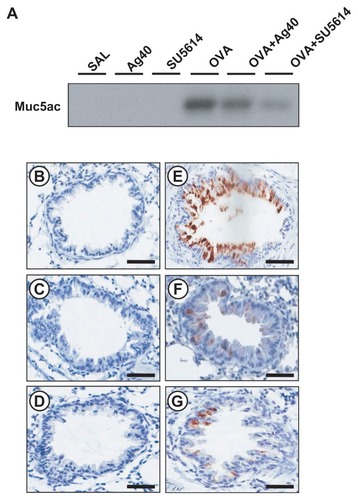
Figure 8 Effect of silver NPs and SU5614 on the protein expression of EGFR in lung tissues collected from ovalbumin-sensitized and ovalbumin-challenged mice. Western blot analysis of EGFR in total protein extracts from lung tissues. EGFR was measured 48 hours after the final challenge in saline-inhaled mice administered saline (SAL), saline-inhaled mice administered 40 mg/kg of silver NPs (Ag40) or SU5614 (SU5614), ovalbumin-inhaled mice administered saline (OVA), and ovalbumin-inhaled mice administered 40 mg/kg of silver NPs (OVA+Ag40) or SU5614 (OVA+SU5614). Blots were stripped and reprobed for actin as a loading contol.
Abbreviations: EGFR, epidermal growth factor receptor; NP, nanoparticle.
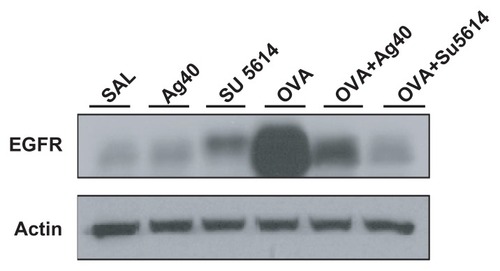
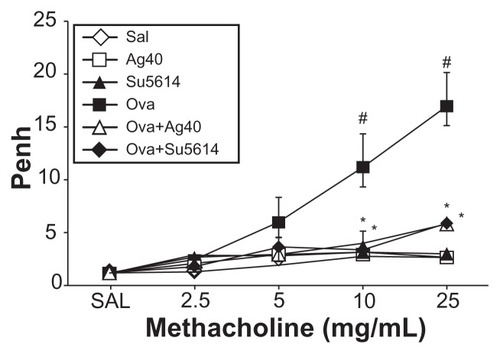
Figure 9 Effect of silver NPs on airway responsiveness to inhaled methacholine in ovalbumin-sensitized and ovalbumin-challenged mice. Airway hyperresponsiveness was measured at 24 hours after the final challenge in saline-inhaled mice administered saline (SAL), saline-inhaled mice administered 40 mg/kg of silver NPs (Ag40) or SU5614 (SU5614), ovalbumin-inhaled mice administered saline (OVA), and ovalbumin-inhaled mice administered 40 mg/kg of silver NPs (OVA+Ag40) or SU5614 (OVA+SU5614).
Notes: Penh values were obtained in response to increasing doses (from 2.5 to 25 mg/mL) of methacholine. Bars indicate the mean ± standard error of the mean for eight mice per group in four to six independent experiments. *P < 0.05 versus OVA; #P < 0.05 versus SAL.
Abbreviations: NP, nanoparticle; Penh, enhanced pause.