Figures & data
Figure 1 FT-IR spectroscopy related to structures of MS-NH2 and MS-SA.
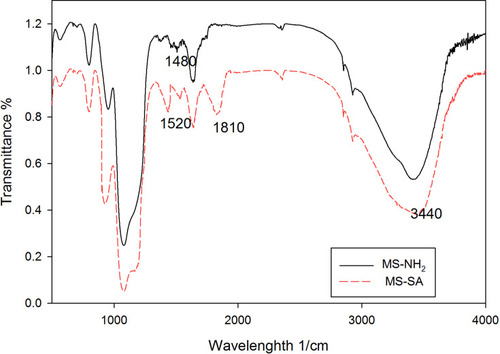
Figure 2 XRD pattern of MS-NH2 and MS-SA.
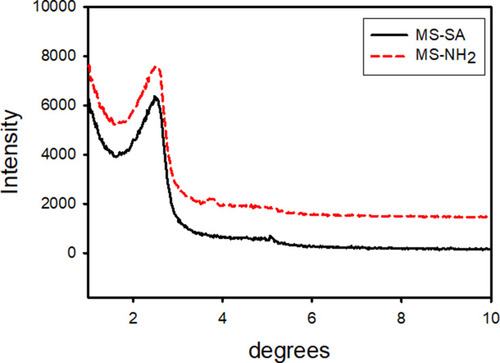
Figure 3 EDX analysis of MS-NH2 (A) and MS-SA (B).
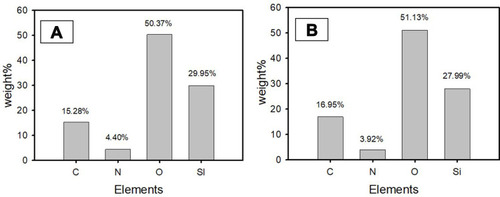
Figure 4 FE-SEM image of synthesized MS-NH2 (A) and MS-SA (B). HR-TEM images of synthesized MS-SA (C).
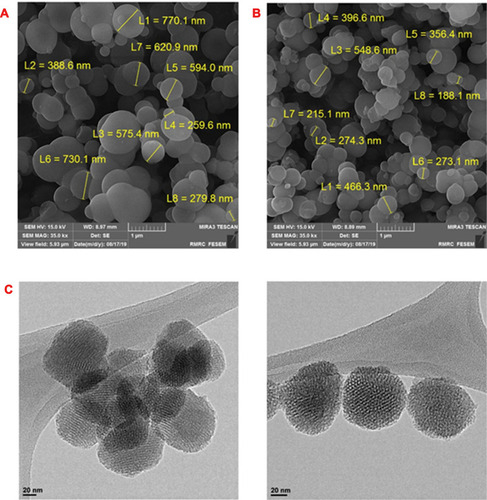
Figure 5 Particle size distribution of synthesized MS-SA (A). Zeta potential of synthesized MS-NH2 and MS-SA (B).
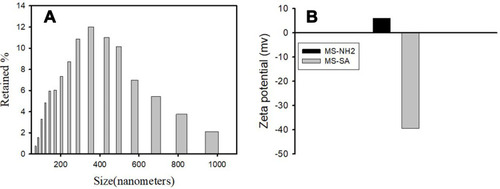
Figure 6 XPS spectra of synthesized MS-SA for the identification of surface elemental composition.
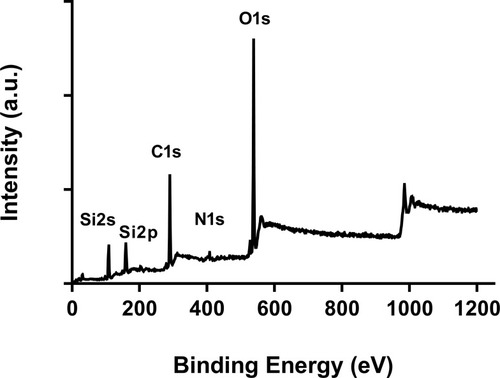
Figure 7 In vitro evaluation of ammonium ion adsorption capability of MS-NH2 and MSN-SA at different time intervals. (A–C) indicate 1, 2, and 3 hours after incubation, respectively. It is noteworthy to mention that the ammonium ion adsorbing capacity of MS-NH2 and MSN-SA was not time-dependent in the current study. Data are given as mean±SD (n = 6); Columns with different superscripts are significantly different (P < 0.05).
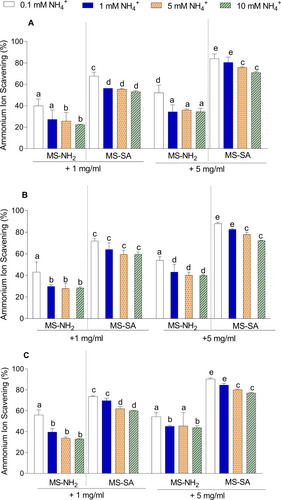
Figure 8 Bio-imaging of fluorescent-labeled MS-SA in the rat.
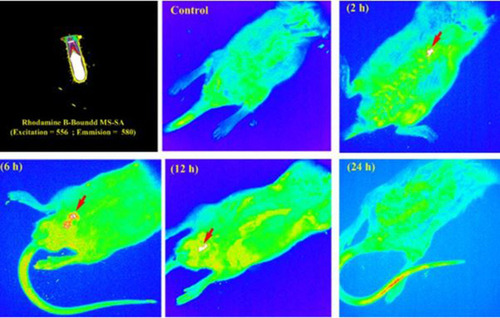
Figure 9 Plasma biomarkers of liver damage and histopathological changes in liver tissue in thioacetamide rats (TAA). Histopathological changes in liver tissue in the thioacetamide model of acute liver failure revealed severe degeneration of the balloon (red arrow), inflammation (yellow arrow), and necrosis (green arrow). Data are given as mean±SD (n = 8). #Shows significantly different as compared with the control group (P < 0.05).
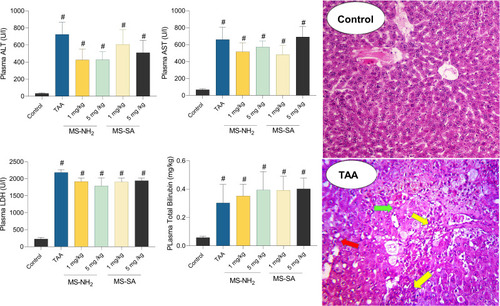
Figure 10 Brain and plasma ammonia ion level in MS-NH2 and MS-SA-treated rat model of hepatic encephalopathy.
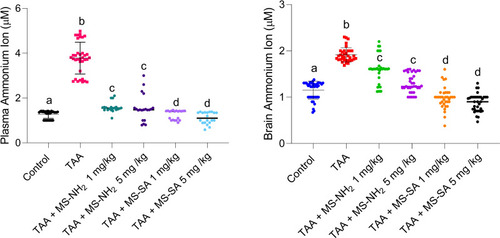
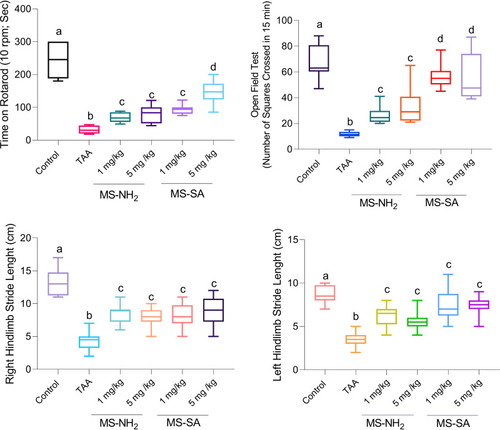
Figure 11 Animal’s locomotor activity in MS-NH2 and MSN-SA-treated rat model of hyperammonemia and hepatic encephalopathy.