Figures & data
Figure 1 Schematic illustration of the proposed polycarbonate-based biosensor.
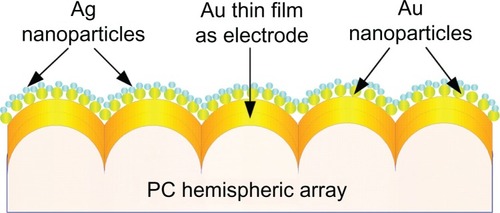
Figure 2 Fabrication procedures for the nano replica mold.
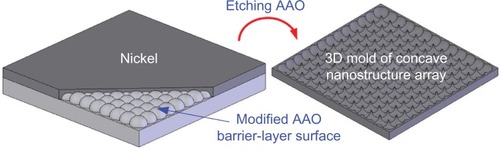
Figure 3 Images of a polycarbonate nanohemisphere array created using hot-embossing; (A) real products; (B) Scanning electron microscopic image.
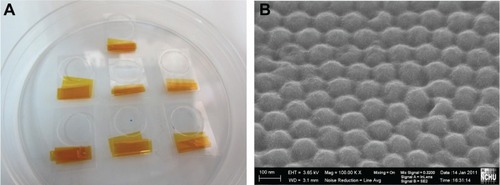
Figure 4 Scanning electron microscopic image of gold nanoparticles synthesized by electrochemical deposition.
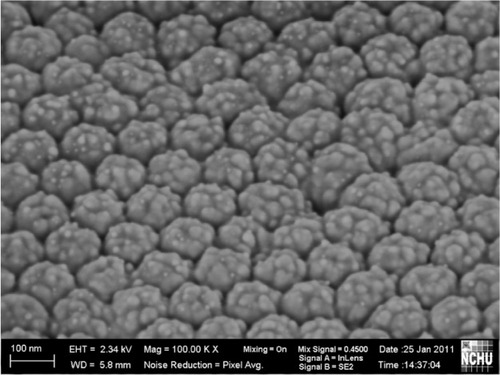
Figure 5 Cyclic voltammetry and I-t curves transformed from the cyclic voltammetry for the film before deposition of the nanostructure thin gold film and the gold nanoparticle-deposited electrodes.
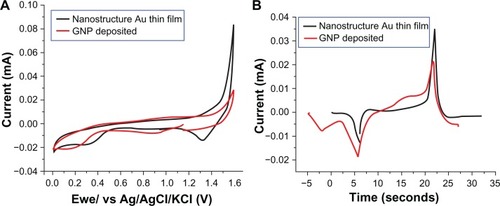
Figure 6 Electrochemical impedance spectroscopy results: (A) Impedance plots for Der p2 at various concentrations: (a) IgG, (b) 10−13 g/mL, (c) 10−12 g/mL, (d) 10−11 g/mL, (e) 10−10 g/mL, (f) 10−9 g/mL, (g) 10−8 g/mL; (B) ΔRet as a function of the logarithmic concentration of Der p2 for the proposed polycarbonate-based biosensor.
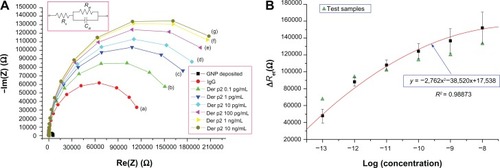
Table 1 Fitting parameters for the Randles’ equivalent circuit