Figures & data
Figure 1 Synthesis scheme of brucine immuno-nanoparticles.
Abbreviation: PEG-PLA-COOH, carboxylated polyethylene glycol-polylactic acid block copolymer.
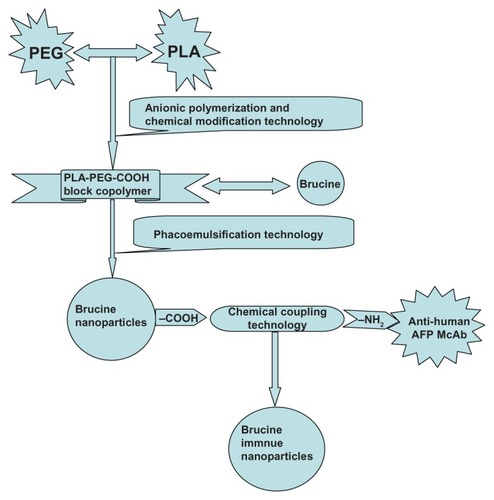
Figure 2 Scanning electron microscope image of brucine immuno-nanoparticles (100,000× magnification).

Figure 3 Release curve of brucine immuno-nanoparticles in vitro. Brucine was completely released within 2 hours. Brucine immuno-nanoparticles were very stable in the medium with an accumulative release rate of over 80% in 24 hours and 100% in 48 hours.
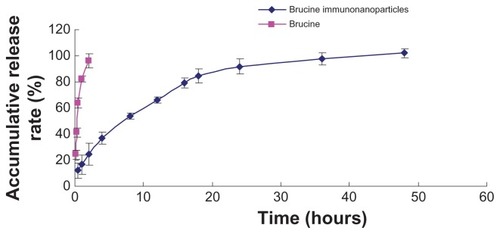
Figure 4 Cell targeting and positioning of the brucine immuno-nanoparticles. Complete uptake and even distribution of the brucine immuno-nanoparticles around the liver cancer cell membrane after incubation for 4 hours (A) ring green fluorescence; (B) without laser excitation; 400× magnification.
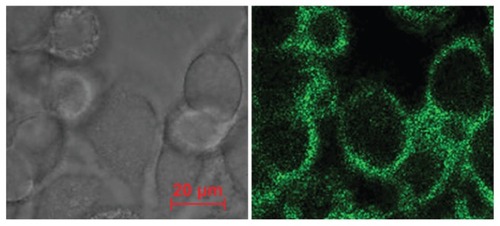
Figure 5 Growth effect of brucine immuno-nanoparticles on liver cancer cells. Liver cancer cells shrank and pseudopodia disappeared at a brucine concentration of 1.0 μg/mL in brucine immuno-nanoparticles for 72 hours in vitro (A). The number of liver cancer cells dropped, and liver cancer cells were sparse and round at a brucine concentration of 40 μg/mL in brucine immuno-nanoparticles for 72 hours in vitro (B). Liver cancer cells showed cytoplasm “bubble” phenomena and low adhesion capacity, and more cell debris could be found at a brucine concentration of 160 μg/mL in brucine immuno-nanoparticles for 72 hours in vitro (C) (200× magnification).
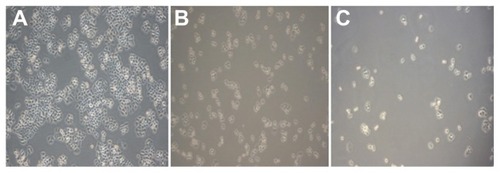
Figure 6 The growth inhibition curve of the brucine immuno-nanoparticles on liver cancer cells. Brucine immuno-nanoparticles have more significant inhibitory effects on the hepatoma cells SMMC-7721 than brucine or brucine nanoparticles for 72 hours. Time- and dose-dependent effects were observed.
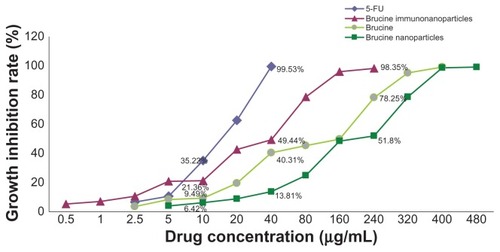
Figure 7 Half maximal inhibitory concentration (IC50) of the brucine immuno-nanoparticles on liver cancer cells. The half maximal inhibitory concentration of the brucine immuno-nanoparticles was lower than that of brucine or brucine nanoparticles. The IC50 of the brucine immuno-nanoparticles (28.2 μg/mL) was close to that of 5-FU (16.7 μg/mL).
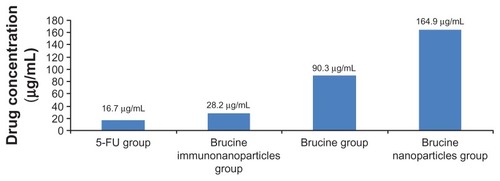
Figure 8 The matrix adhesive rate of the brucine immuno-nanoparticles on liver cancer cells. Compared with brucine and brucine nanoparticles, brucine immuno-nanoparticles had the strongest inhibition effects on liver cancer cell matrix adhesion for 72 hours.
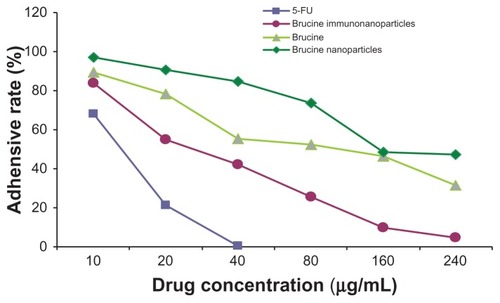
Figure 9 The number of cells permeating through the filter pores from the underside of the filter after brucine immuno-nanoparticles were applied at various concentrations to liver cancer cells for 72 hours (200× magnification). As the drug concentration increased, the number of cell invasions decreased. (A) 10 μg/mL; (B) 20 μg/mL; (C) 40 μg/mL; (D) 80 μg/mL.
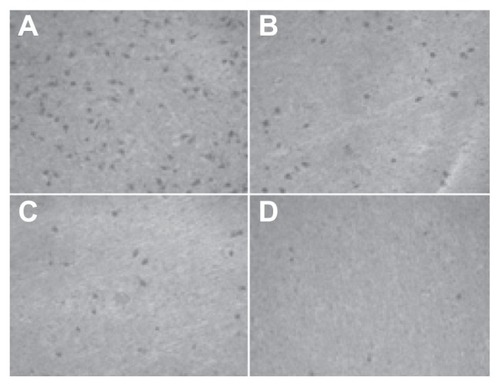
Figure 10 The invasion rate of the brucine immuno-nanoparticles on liver cancer cells. Compared with brucine and brucine nanoparticles, brucine immuno-nanoparticles had the strongest inhibition effects on liver cancer cell invasion after 72 hours.
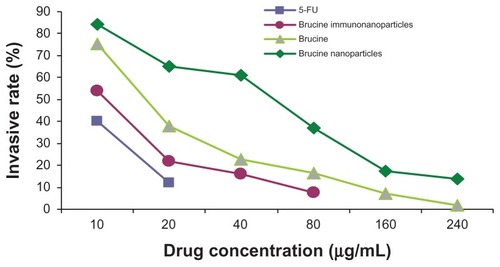
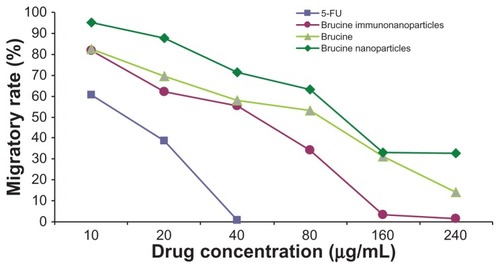
Figure 11 The number of cells migrating through the filter pores from the underside of the filter after brucine immuno-nanoparticles were applied at various concentrations to liver cancer cells for 72 hours (200× magnification). As the drug concentration increased, the cell migration decreased. (A) 10 μg/mL; (B) 20 μg/mL; (C) 40 μg/mL; (D) 80 μg/mL; (E) 160 μg/mL; (F) 240 μg/mL.
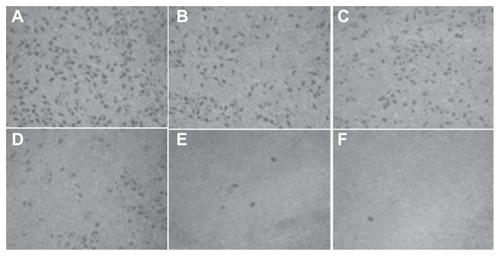
Figure 12 The migratory rate of the brucine immuno-nanoparticles on liver cancer cells. Compared with brucine and brucine nanoparticles, brucine immuno-nanoparticles had the strongest inhibitory effect on liver cancer cell migration.