Figures & data
Figure 1 Particle size distribution (A and C) for DCNP4 and DPNC6, and transmission electron microscopy images (B and D), for DCNP4 and DPNC6 respectively.
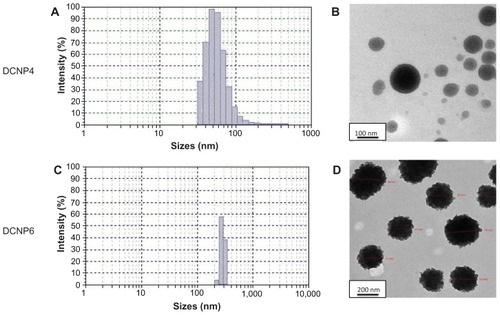
Figure 2 The amount of doxycycline release over a 24-hour period for DCNP4 and DCNP6 both with an initial burst effect within the first 4 to 5 hours followed by a decrease in amount of drug being release then to a slow sustained amount for the remaining hours.
Note: Data shown are the mean ± standard deviation (n = 3).
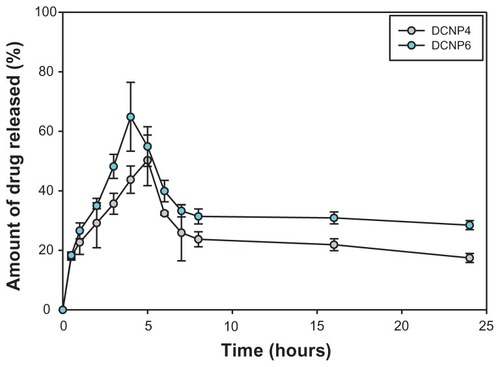
Figure 3 Inhibitory effects of drug-loaded chitosan nanoparticles on bacterial growth, expressed in terms of percentage of remaining bacteria after 4 hours of treatment. Minimum inhibitory concentration values are as follows: DCNP4 = 16 μg/mL, DCNP6 = 13 μg/mL, and Doxy = 13 μg/mL. The untreated tube was used to define the “100% remaining” (no inhibition) case.
Note: Data shown are the mean ± standard deviation (n = 3).
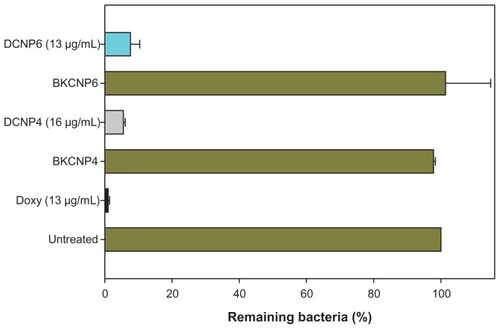
Figure 4 Five-day cell viability for human ovarian surface epithelial cells exposed to blank nanoparticles, drug-loaded nanoparticles, and unencapsulated doxycycline. A higher formazan absorbance indicates greater cell viability.
Note: Data shown are the mean ± standard deviation (n = 3).
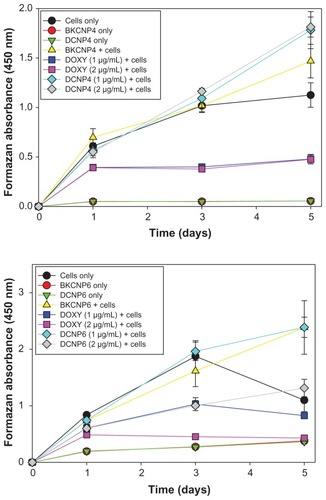
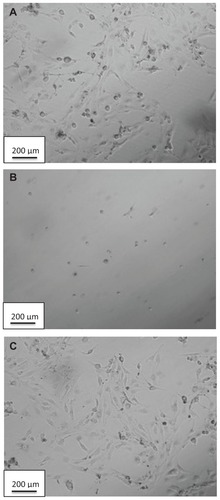
Figure 5 Bright-field images of human ovarian surface epithelial cells after being exposed to (A) no treatment (control), (B) doxycycline at 2 μg/mL, and (C) DCNP4 at 2 μg/mL.
Note: Magnification 10×.