
Figures & data
Table 1 The Parameters of the Uptake and Elimination Kinetics of uNPs and cNPs in SF and SR Conditions
Figure 1 The intracellular accumulation profiles of the uNPs (A and C) and the cNPs (B and D) under SF and SR conditions respectively.
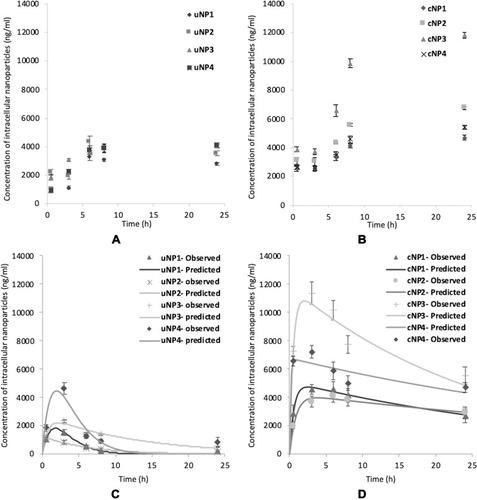
Table 2 The Sum of the % ID/g of the Vascular Compartment (Plasma and Heart), the RES Organs (Kidneys, Liver and Spleen) and Lungs, and the Tumor Tissue for the uNPs and cNPs
Figure 2 The in vivo biodistribution of the uNPs and cNPs expressed as a percentage of the total injected dose per gram tissue (% ID/g) after 2, 6, and 24 h post the IV administration of uNP1 and cNP1 (A–C), uNP2 and cNP2 (D–F), uNP3 and cNP3 (G–I) and uNP4 and cNP4 (J–L). *0.01< P value <0.05; **0.001<P value<0.01; ***P value < 0.001; ****P value < 0.0001.
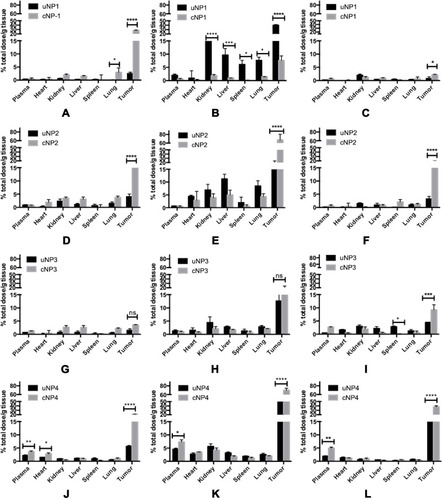
Table 3 The PK Parameters of the uNPs and the cNPs in the Vascular Compartment (the Plasma and the Heart)
Table 4 The PK Parameters of the uNPs and the cNPs in the RES (the Kidney, the Liver and the Spleen) and the Lungs
Table 5 The PK Parameters of the uNPs and the cNPs in the Tumor Tissue