Figures & data
Figure 1 UV-VIS spectra of AgNPs-CIT reduced by TSC. The UV-VIS spectra of AgNPs-CIT showed a small redshift in the surface plasmon resonance peak for each NPs. Each peak represents the reduction with TSC at 2, 4, 6, 8, 10, and 12 min.
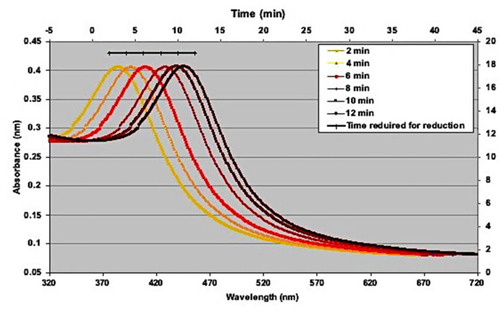
Figure 2 The size distribution of AgNPs-CIT; (A). The mean particle size (nm), (B). ζ-potentials (mV), and polydispersity indices of all AgNPs-CIT at 2, 4, 6, 8, 10, and 12 min; (C). SEM image of AgNPs-CIT reduced after 10 min.
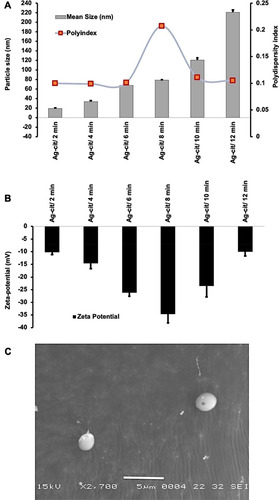
Figure 3 FT-IR spectra of silver nitrate (AgNO3), AgNPs-CIT, and TSC. The black arrows represent the citrate area in TSC and AgNPs-CIT.
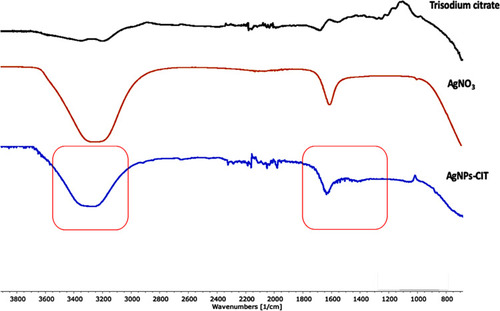
Figure 4 AgNPs-CIT radical scavenging (%) activity with DPPH, and hydrogen peroxide.
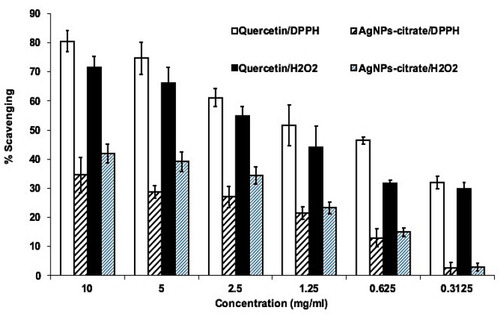
Figure 5 (A) Effects of AgNPs-CIT concentration (0.1–160 µM) on viability of MCF-7 cell lines. (B) Effects of AgNPs-CIT treatment time (4–48 hours) on viability of MCF-7 cell lines. (C) Effects of AgNPs-CIT on the proliferation of PMA-stimulated MCF-7 cell lines. MCF-7 cell lines were pretreated with AgNPs-CIT NP (0.5–10 µM) for 2 hours before stimulation with PMA (0.5 µM). #p<0.01 versus untreated cells; @p<0.01 versus PMA alone treated MCF-7 cells.
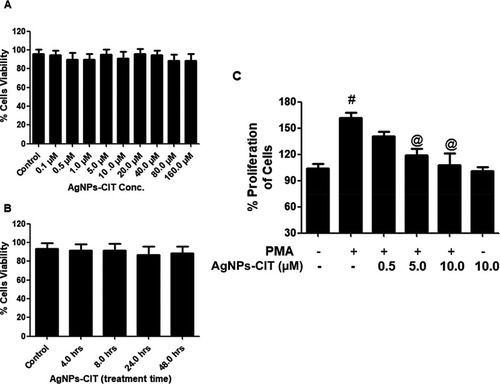
Figure 6 Gene and protein expression of TNFα. (A) Effect of AgNPs-CIT on PMA-induced gene expression of TNFα. Folds of TNFα mRNA expression as compared with control and normalized to GAPDH were determined by quantitative RT-PCR. (B) Effect of AgNPs-CIT on PMA-induced TNFα production in the culture medium of MCF-7 cell lines. The production level of TNFα was determined by sandwich ELISA. Results are representative (mean ± standard error of the mean) of triplicate experiments. #p<0.001 versus untreated MCF-7 cells; @p<0.01 versus PMA alone treated MCF-7 cells.
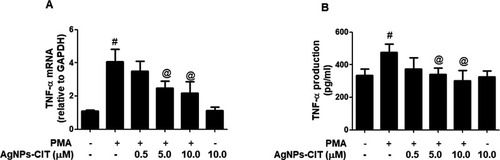
Figure 7 Effect of AgNPs-CIT and BAY on PMA-induced NF-κB pathway in MCF-7 cells. (A) Effect of BAY 11–7082 on PMA-induced TNF-α mRNA expression. #p<0.01 versus untreated MCF-7 cells, (B) Effect of BAY 11–7082 on PMA-induced TNF-α protein secretion in the culture medium of MCF-7 cells. @p<0.01 versus PMA alone treated MCF-7 cells, (C) Effect of AgNPs-CIT and BAY 11–7082 on PMA-induced NF-κB activation in the nuclear extract of MCF-7 cells. *p<0.05 versus PMA alone treated MCF-7 cells.
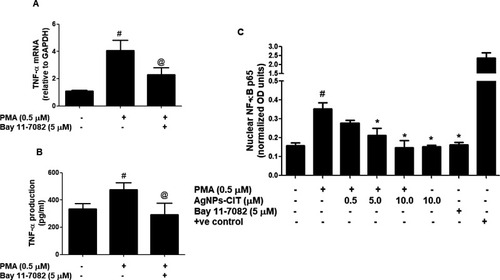
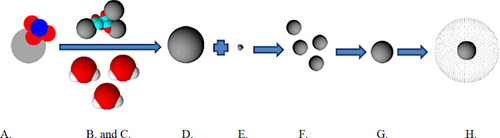
Figure 8 Schematic representation of the reaction mechanism of the silver nanoparticles formation: (A) Silver Nitrate (AgNO3), (B). Tri-Sodium Citrate (TSC), (C). Water Molecules, (D). Silver ions, (E). Electron, (F). Nano-seeds (primitive nanoparticles). (G). Nucleation, aggregation of smaller nano-seeds, (H). Nanoparticle stabilization by citrate ions.