Figures & data
Figure 1 Diffusion cell for in vitro extraction experiments. The function of the silicon gasket is to prevent leakage of liquid between the electrode chambers and to ensure that current only passes through the skin without any current leakage between electrode chambers. This figure is modified from Lee et al.Citation21
Abbreviations: PBS, phosphate-buffered saline; PSA, prostate-specific antigen; OPN, osteopontin.
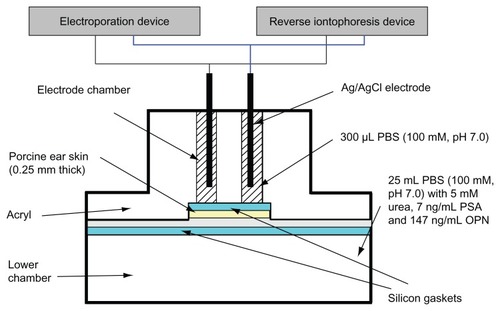
Table 1 Experimental protocol to show various combinations of electroporation and reverse iontophoresis for in vitro extraction experiments
Figure 2 Experimental protocol showing the time sequence for skin impedance measurements, application of electroporation and reverse iontophoresis, and sample collection.
Note: Each in vitro extraction experiment took 38 minutes.
Abbreviations: min, minutes; s, seconds.
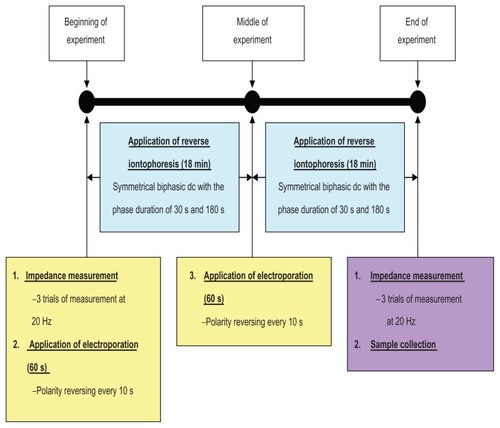
Figure 3 In vitro studies (n = 3 for each bar) of the transdermal and noninvasive extraction of urea by electroporation, reverse iontophoresis, and a combination of these methods. For the electroporation setting, they all have the same pulse width of 1 msec and number of pulses per second of 10. The legend shows the reverse iontophoresis setting, which is a symmetrical biphasic dc with a current density of 0.3 mA/cm2.
Notes: Results are expressed as the mean ± standard deviation. **P < 0.001.
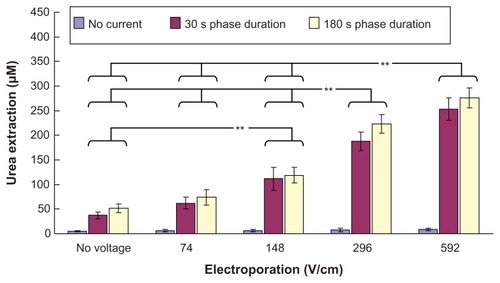
Figure 4 In vitro studies (n = 3 for each bar) of transdermal and noninvasive extraction of PSA by various electroporation, reverse iontophoresis, and a combination of the two methods. For the electroporation setting, they all have the same pulse width of 1 msec and number of pulses per second of 10. The legend shows the reverse iontophoresis setting, which is a symmetrical biphasic dc with a current density of 0.3 mA/cm2.
Notes: Results are expressed as mean ± standard deviation.**P < 0.001, *P < 0.05.
Abbreviation: PSA, prostate-specific antigen.
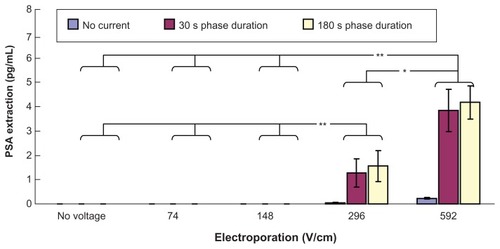
Figure 5 In vitro studies (n = 3 for each bar) of transdermal and noninvasive extraction of osteopontin by various electroporation, reverse iontophoresis, and a combination of the two methods. For the electroporation setting, they all have the same pulse width of 1 msec and the number of pulses per second of 10. The legend shows the reverse iontophoresis setting, which is a symmetrical biphasic dc with a current density of 0.3 mA/cm2.
Notes: Results are expressed as the mean ± standard deviation. **P < 0.001.
Abbreviation: OPN, osteopontin.
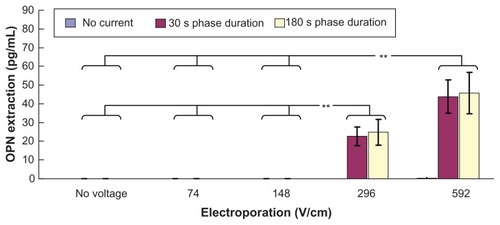
Figure 6 Effect of electroporation and reverse iontophoresis on the ratio of pre-experimental to post-experimental skin impedance (ie, Zbefore/Zafter). All skin impedance measurements were conducted at 20 Hz. For the electroporation setting, they all have the same pulse width of 1 msec and the number of pulses per second of 10. The legend shows the reverse iontophoresis setting, which is a symmetrical biphasic dc with the current density of 0.3 mA/cm2.
Notes: Results (n = 3) are expressed as the mean ± standard deviation. **P < 0.001; *P < 0.05, respectively.
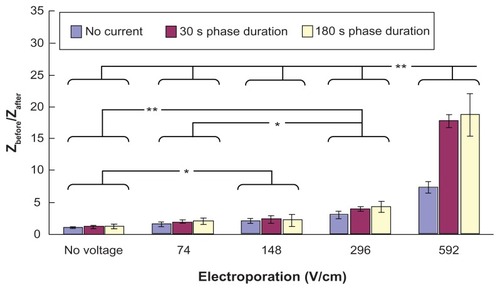
Figure 7 Effect of electroporation (electric field strength = 592 V/cm; pulse width = 1 msec; number of pulses per second = 10) and reverse iontophoresis (symmetrical biphasic dc; current density = 0.3 mA/cm2; phase duration = 180 seconds) on the ratio of pre-experimental to post-experimental skin impedance at various times after the extraction experiment.
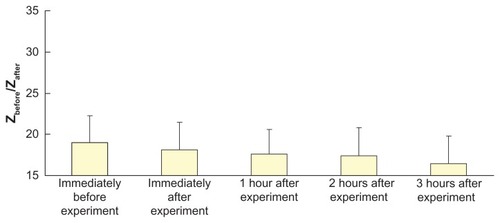
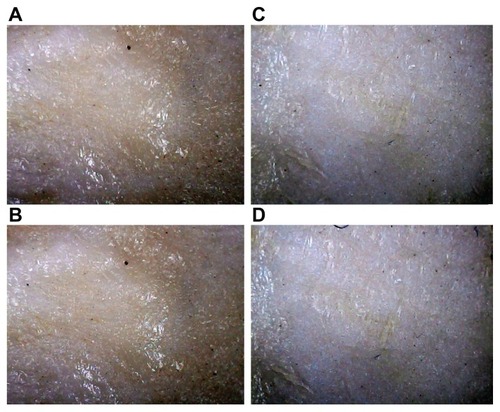
Figure 8 Pictures of the skin surface before and after each extraction experiment. All pictures were captured by a microscope with a magnification of 60×. (A and B) Before and after the extraction experiment, respectively, with application of electroporation (74 V/cm) and reverse iontophoresis (phase duration = 180 seconds). (C and D) Before and after extraction experiment, respectively, with application of electroporation (592 V/cm) and reverse iontophoresis (phase duration = 180 seconds).