Figures & data
Table 1 The Independent and Dependent Variables for the 32 Full Factorial Design Used for the Preparation of FTN Loaded TPs
Table 2 Output Data of the 32 Full Factorial Analysis of TPs Formulations and Predicted and Observed Values for the Selected TPs (TP2)
Figure 1 The effect of (A) terpene type and (B) terpene amount on EE% of FTN loaded TPs.
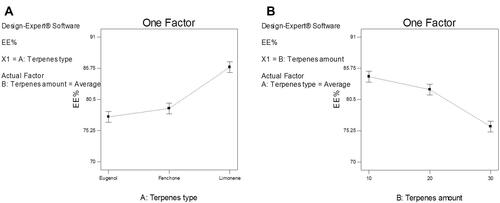
Figure 2 The effect of (A) terpene type and (B) terpene amount on PS of FTN loaded TPs.
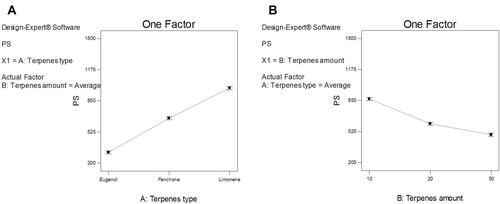
Figure 3 The effect of (A) terpene type and (B) terpene amount on PDI of FTN loaded TPs.
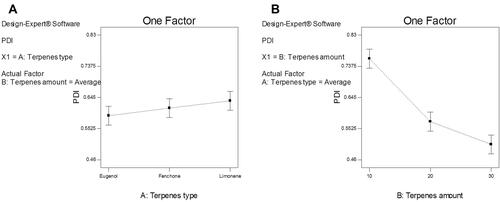
Table 3 Experimental Runs, Independent Variables, and Measured Response of the 32 Full Factorial Experimental Design of FTN Loaded TPs
Table 4 Characterization Results for the Selected TPs (TP2) and the Optimized TPs
Figure 4 Morphology of the optimized TPs.
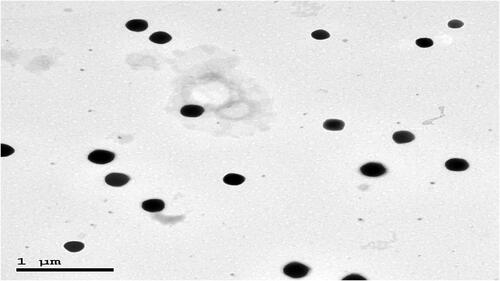
Figure 5 In-vitro release profile of FTN from the optimized TPs in comparison with that of drug suspension.
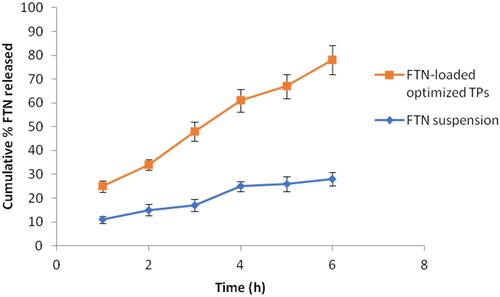
Figure 6 In vivo study graphical chart of FTN suspension and FTN-loaded TPs treated groups.
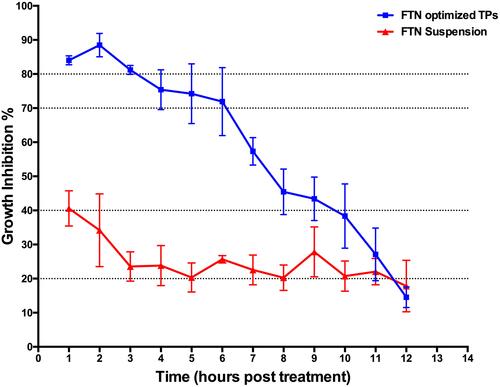
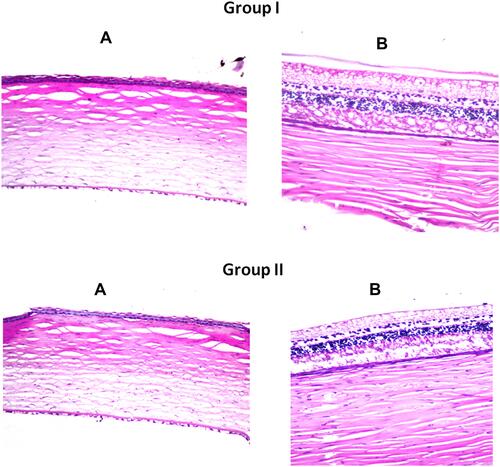
Figure 7 Photomicrographs showing histopathological sections (hematoxylin and eosin stained) of normal untreated rabbit’s eye (group I) and rabbit’s eye treated with FTN loaded optimized TPs (group II). (A) illustrates histological structure of the cornea and (B) illustrates histological structure of the retina, choroid and sclera.