Figures & data
Table 1 Properties of commercial carbon nanotubes as provided by suppliers
Figure 1 Ash content and oxidation temperature of carbon nanotubes. The ash content and oxidation temperature for four single-walled carbon nanotubes and twelve multi-walled carbon nanotubes was experimentally determined using thermogravimetric analysis. Ash content is illustrated in the histogram, and oxidation temperature is in the scatter plot. Experimentally determined thermogravimetric analysis values (black bars or dots) are contrasted to the manufacturers’ reported values, where available (gray bars or dots).
Abbreviations: SWNT, single-walled carbon nanotubes; MWNT, multi-walled carbon nanotubes.
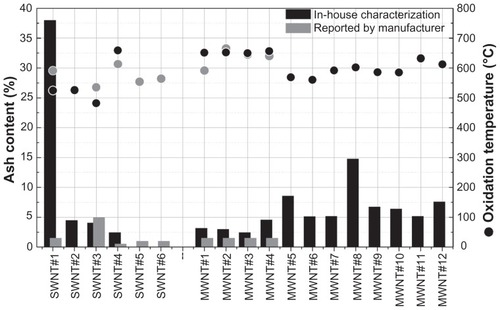
Figure 2 Raman spectra of multi-walled and single-walled carbon nanotubes. Dry powder samples of six single-walled carbon nanotubes and twelve multi-walled carbon nanotubes were analyzed using Raman spectroscopy at a wavelength of 532 nm. Spectra are shown as Raman intensity as a function of wavenumber (cm−1), where characteristic peaks representing the radial breathing mode, D-band, G-mode, and G’-mode for a typical carbon nanotube Raman spectrum are shown in panel 3 (single-walled carbon nanotube sample 3).
Abbreviations: SWNT, single-walled carbon nanotubes; MWNT, multi-walled carbon nanotubes.
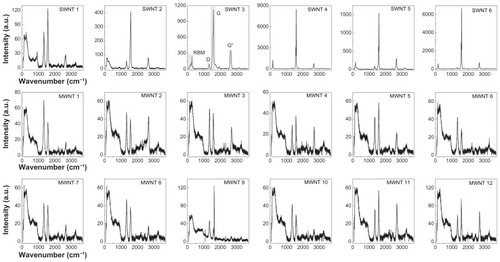
Figure 3 Structural quality of carbon nanotube samples. ID/IG band intensity ratios were determined from the Raman spectra of all single-walled and multi-walled carbon nanotube samples. A lower ID/IG ratio (shorter bars) indicates fewer defects and therefore higher structural quality. Due to the limitations of this method, the higher observed values for the multi-walled carbon nanotube samples is not necessarily indicative of a higher number of defects.
Abbreviations: SWNT, single-walled carbon nanotubes; MWNT, multi-walled carbon nanotubes.
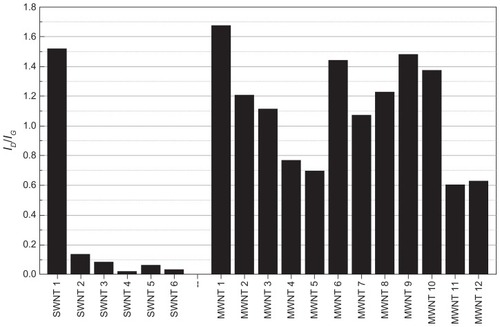
Table 2 Comparison of SWNT diameters as reported by manufacturer and determined experimentally through Raman spectroscopy
Table 3 Average extinction coefficients (ɛave, with corresponding variation) of carbon nanotubes in 1,2-dichlorobenzene
Figure 4 Experimentally determined average standard curves of carbon nanotube dispersions in 1,2-dichlorobenzene. Absorbance values for a seven-point dilution series of carbon nanotube samples was measured using an ultraviolet-visible near infrared spectrophotometer at a wavelength of 500 nm. Average absorbance values for (A) the six single-walled carbon nanotubes (P < 0.05), (B) six NanoLab multi-walled carbon nanotubes (P > 0.05) and (C) four Cheaptubes multi-walled carbon nanotubes (P > 0.05), and our two inhouse multi-walled carbon nanotubes (P > 0.05).
Note: P values were calculated using one-way analysis of variance with a Tukey multiple comparison post-test for n = 15 at a 95% confidence value.
Abbreviations: SWNT, single-walled carbon nanotubes; MWNT, multi-walled carbon nanotubes.
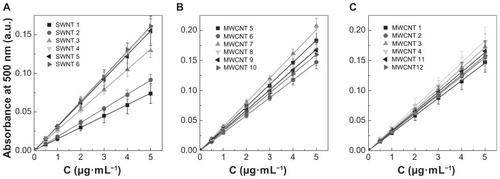
Figure 5 Experimental standard curves of multi-walled CNT sample 2 and multi-walled CNT sample 3 dispersions in 1,2-dichlorobenzene. Experimentally determined seven-point standard curves of five different stock solutions and an average curve were determined using an ultraviolet-visible near infrared spectrophotometer at a wavelength of 500 nm. Cheaptubes multi-walled carbon nanotube sample 2 in 1,2-dichlorobenzene (P > 0.05) (A) and Cheaptubes multi-walled carbon nanotube sample 3 in 1,2-dichlorobenzene (P > 0.05) (B). Multi-walled carbon nanotube sample 2 had an average extinction coefficient of 51.4 ± 2.9 mL·cm−1· mg−1 and a percentage deviation of 5.6%, meanwhile multi-walled carbon nanotube sample 3 had an average extinction coefficient of 58.0 ± 7.3 mL· cm−1· mg−1 with 12.6% deviation. Note: P values were calculated using one-way analysis of variance with a Tukey multiple comparison post-test for n = 15 at a 95% confidence value.
Abbreviations: SWNT, single-walled carbon nanotubes; MWNT, multi-walled carbon nanotubes.
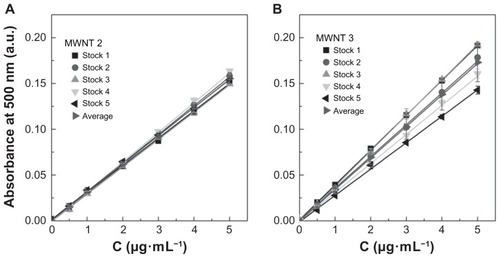
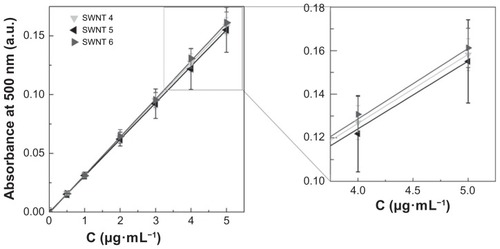
Figure 6 Experimental standard curves of single-walled carbon nanotube sample 4–6 dispersions in 1,2-dichlorobenzene. Experimentally determined seven-point average standard curves of NanoIntegris single-walled carbon nanotube samples 4–6 (P > 0.05) were determined using an ultraviolet-visible near infrared spectrophotometer at a wavelength of 500 nm. The inset shows the standard curve at higher concentration for better comparison. The standard curve of single-walled carbon nanotube sample 4 is an exact superposition of the standard curves of single-walled carbon nanotube samples 5 and 6 in a ratio of 1:2, respectively (representing the structural composition of single-walled carbon nanotube sample 4).
Note: P values were calculated using one-way analysis of variance with a Tukey multiple comparison post-test for n = 15 at a 95% confidence value.
Abbreviations: SWNT, single-walled carbon nanotubes; MWNT, multi-walled carbon nanotubes.