Figures & data
Figure 1 Schematic diagram of the coaxial electrospinning process (A) and digital pictures of the process (B).
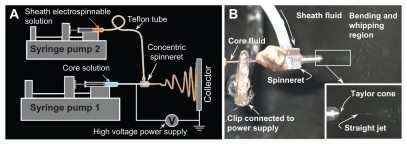
Figure 2 Characterization of the electrospun core-sheath nanofibers. (A) FESEM images of nanofiber surfaces; (B) FESEM images of nanofiber cross-sections; (C) distribution of nanofiber diameters; (D) TEM images of the fiber core-sheath structure.
Abbreviations: FESEM, field emission scanning electron microscope; TEM, transmission electron microscopy.
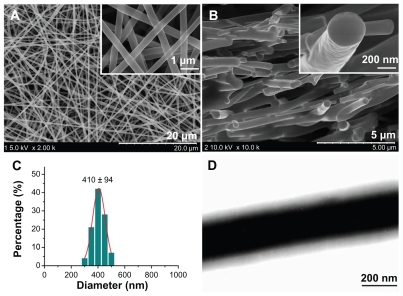
Figure 3 Differential scanning calorimetry thermograms of the components (acyclovir, PVP, SDS, and sucralose) and their core-sheath nanofibers under a heating rate of 10°C per minute and a nitrogen gas flow rate of 40 mL/minute.
Abbreviations: PVP, polyvinylpyrrolidone; SDS, sodium dodecyl sulfate.
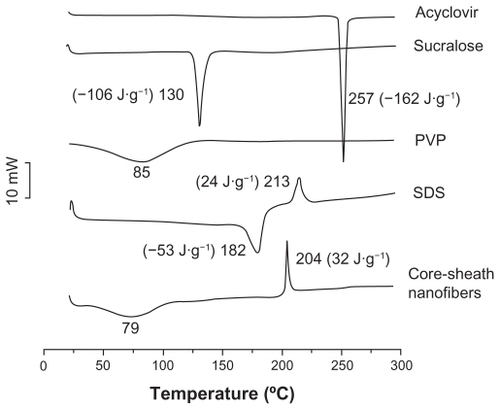
Figure 4 X-ray diffraction patterns of the components (acyclovir, PVP, SDS, and sucralose) and their core-sheath nanofibers with CuKα radiation at 40 mV and 300 mA.
Abbreviations: PVP, polyvinylpyrrolidone; SDS, sodium dodecyl sulfate.
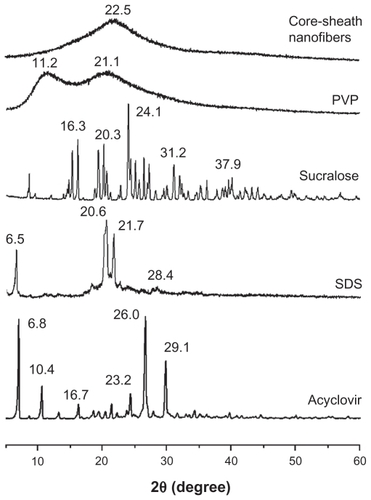
Figure 5 Molecular structures of the components (A) and hydrogen bonding between acyclovir molecules and between acyclovir and PVP molecules (B).
Abbreviation: PVP, polyvinylpyrrolidone.
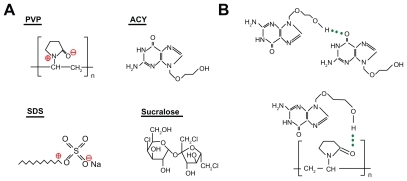
Figure 6 ATR-FTIR spectra of the components (acyclovir, PVP, SDS, and sucralose) and their core-sheath nanofibers at 500–4000 cm−1 and a resolution of 2 cm−1.
Abbreviations: PVP, polyvinylpyrrolidone; SDS, sodium dodecyl sulfate; ATR-FTIR, attenuated total reflectance Fourier transform infrared.
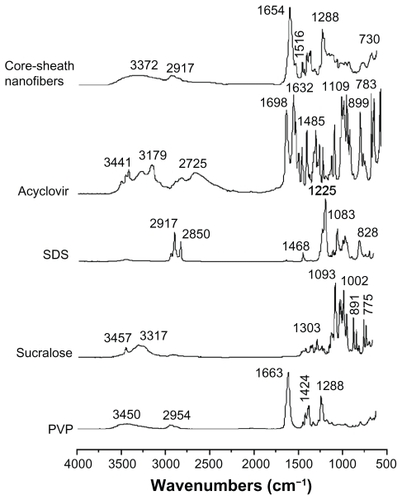
Figure 7 In vitro dissolution profiles of the acyclovir powders and core-sheath nanofiber solid dispersions.
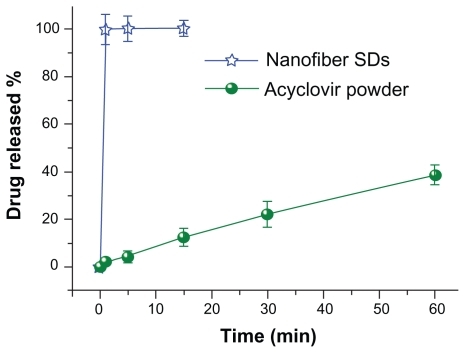
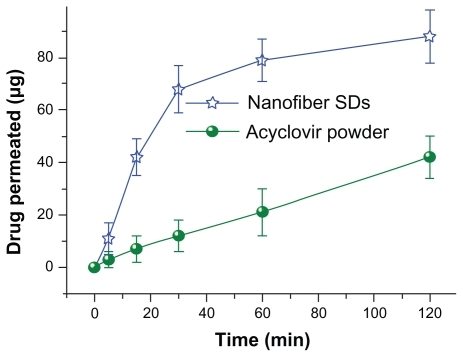
Figure 8 In vitro permeation profiles of the acyclovir powders and core-sheath nanofiber solid dispersions.