Figures & data
Figure 1 Flow diagram of liposomal hydrogel formulation preparation.
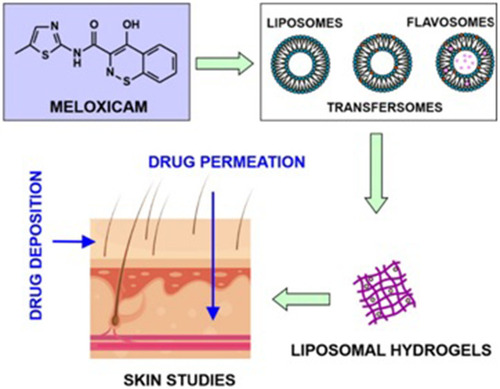
Table 1 The Composition and Type of the Vesicles Investigated in the Study
Table 2 Physiochemical Properties of the Obtained Vesicles. Data are Presented as Means±SD (n=3)
Table 3 Deformability Index of Liposomal Vesicles. Data are Presented as Means±SD (n=3)
Figure 2 Transmission electron microscopy images of (A) conventional liposomes; (B) transfersomes; (C) flavosomes-Q; (D) flavosomes-D.
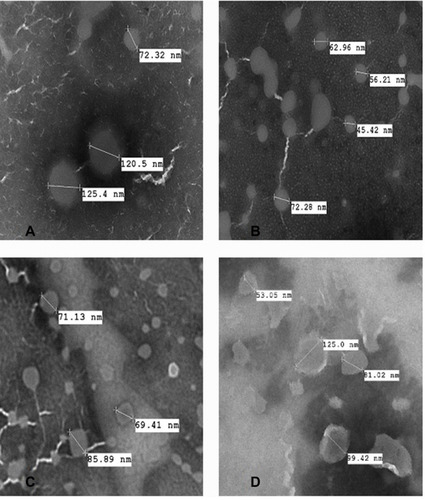
Figure 3 Amplitude sweeping plots obtained for the gels (A) and calculated cross-over values (B) (n=3 for each formulation, data are presented as means±SD).
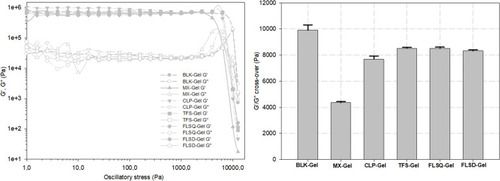
Figure 4 Temperature sweeping of the gels (n=3 for each formulation, data are presented as means±SD).
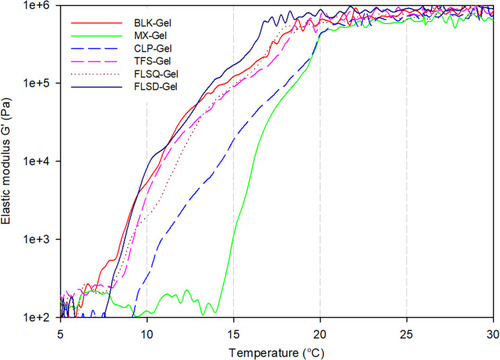
Figure 5 Transmission electron microscopy images of (A) MX-gel, (B) CLP-gel, (C) TFS-gel, (D) FLSQ-gel, (E) FLSD-gel.
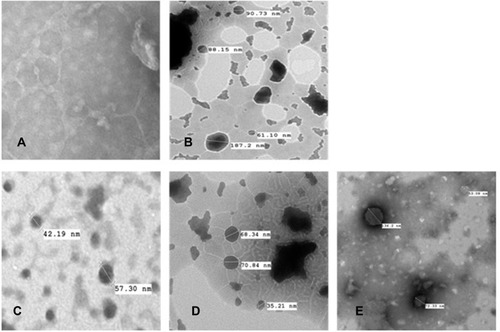
Table 4 Physical Properties of the Obtained LiposomalVesicles and Liposomal Gel Formulations. Data are Presented as Means±SD (n=3)
Table 5 Permeation Parameter Obtained for the Investigated Gel Formulations. Data are Presented as Means±SD (n=3 for Each Formulation)
Figure 6 (A) Ex vivo drug permeation profiles of meloxicam (MX)-loaded liposomal gel formulations over 24 hours; (B) MX deposited in the different layers of skin after 24-hour skin permeation study from formulations tested (n= for each formulation, data are presented as means±SD).
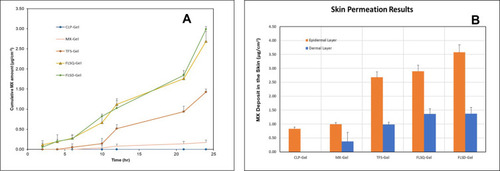
Table 6 Kinetic Models for the Investigated Gel Formulations
Figure 7 Confocal laser scanning microscopy images taken at different depths of the full thickness human cadaver skin after 24 hours permeation of Dil-labeled gel formulations containing (A) untreated skin, (B) CLP-gel, (C) TFS-gel, (D) FLSQ-gel, and (E) FLSD-gel (magnification 10X).
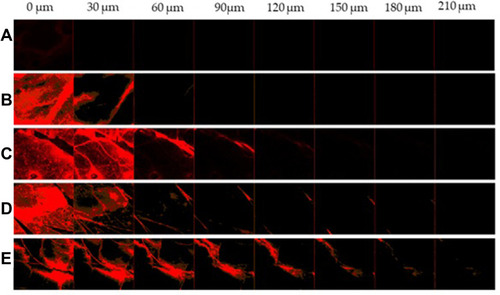
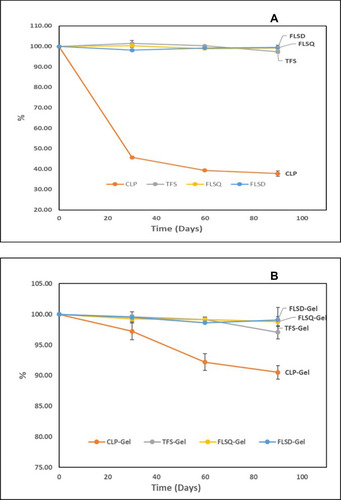
Figure 8 Stability study results of (A) meloxicam-loaded liposomal suspensions at 5±3°C for 30, 60, and 90 days, and (B) meloxicam-loaded liposomal gel formulations at 25±5°C for 30, 60, and 90 days (n=3 for each formulation).