Figures & data
Table 1 Physicochemical characteristics of liposomes with or without encapsulated pTT- fluorescein
Figure 1 Transmission electron microscopic micrograph of liposomes. (Original magnification × 70 K).
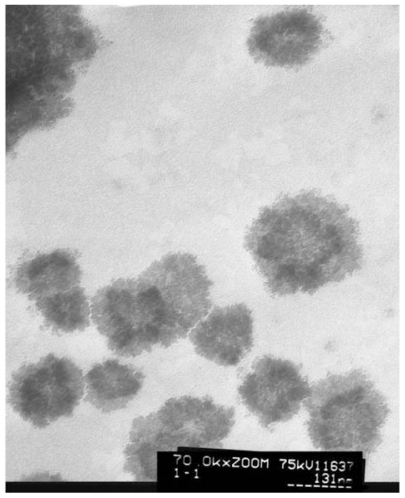
Figure 2 Viability of keratinocytes and fibroblast cells following treatment with pTT in the negative/positive control and liposomal suspensions after incubation for (A) 12 hours and (B) 24 hours.
Note: Data are presented as the mean ± SD (n = 6).
Abbreviation: SD, standard deviation.
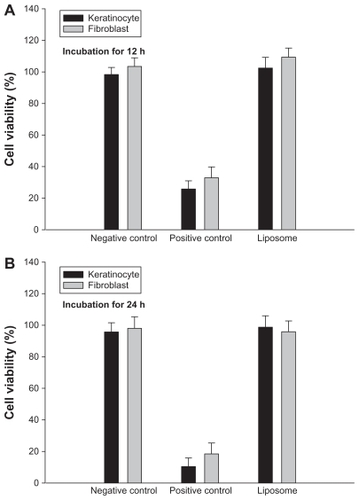
Table 2 In vitro permeation flux and cumulative amount of pTT across murine skin with negative control, positive control, and liposome treatment for 24 hours
Figure 3 In vitro cumulative amount-time profiles of pTT-fluorescein in various vehicles across nude mouse skin.
Note: Data are presented as the mean ± SD (n = 4).
Abbreviation: SD, standard deviation.
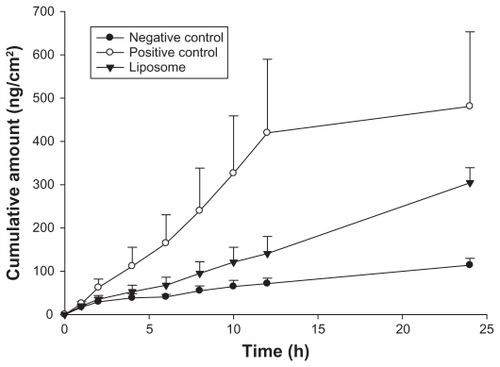
Figure 4 Confocal laser-scanning microscopic (CLSM) micrographs of the pTT-fluorescein intensity after in vivo topical administration in nude mouse skin for 4 hours. Images represent negative control (pTT-fluorescein in an aqueous solution), positive control (pTT-fluorescein in DMSO/PG), and liposomes (pTT-fluorescein-loaded liposomes) sequential scans in the xyz plane, and the full thickness was divided into nine segments from the surface of the skin (left to right). Cumulative xyz images of all optical sections were merged from 0–100 μm in xyz scan. Profile of skin depth versus intensity of the negative control, positive control, and liposome by quantification from CLSM micrographs.
Figure 5 (A) Accumulation of pTT located in nude mouse skin after the in vivo topical administration for 2, 4, 6, and 24 hours (left to right images) analyzed from the negative control (pTT-fluorescein in an aqueous solution), positive control (pTT-fluorescein in DMSO/PG), and liposomes (pTT-fluorescein-loaded liposomes). (B) Quantification of fluorescence intensity from above groups.
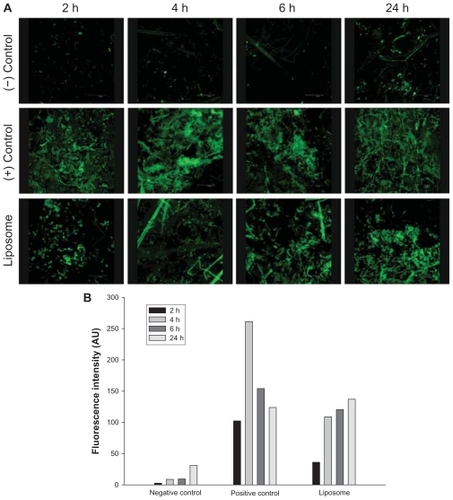
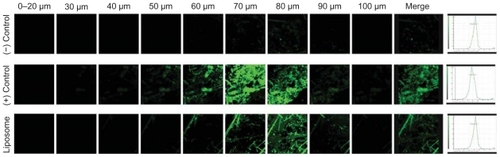
Figure 5 (A) Accumulation of pTT located in nude mouse skin after the in vivo topical administration for 2, 4, 6, and 24 hours (left to right images) analyzed from the negative control (pTT-fluorescein in an aqueous solution), positive control (pTT-fluorescein in DMSO/PG), and liposomes (pTT-fluorescein-loaded liposomes). (B) Quantification of fluorescence intensity from above groups.