Figures & data
Figure 1 Schematic of two microring resonators coupled into a PANDA system.
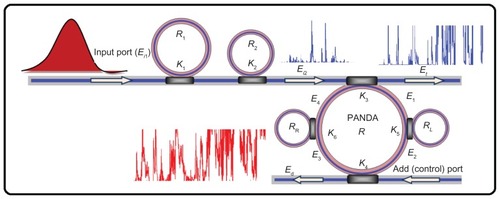
Figure 2 Result of the outputs from two ring resonators with centre wavelength at 1.3 μm: (A) the input Gaussian pulse, (B) the chaotic signal generation, (C) the amplified and filtering signals.
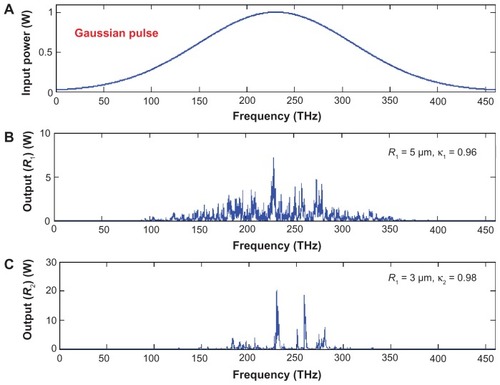
Figure 3 Simulation results of the light pulse generated by the PANDA system at center wavelength of 1.3 μm, where (A) |E1|2, (B) |E2|2, (C) |E3|2, (D) |E4|2, (E) |Ed|2, and (F) |Et|2 are output powers inside a PANDA system.
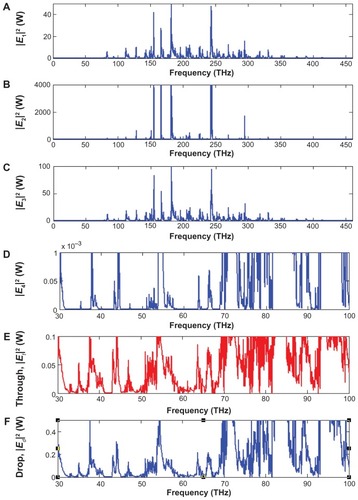
Figure 4 Schematic of an add/drop filter system for area frequency selection.
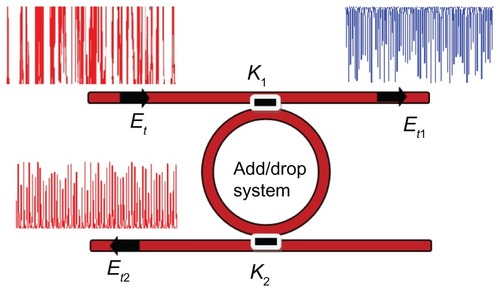
Figure 5 Simulation results of the channel frequency light pulse generated by the add/drop filter system at the center wavelength of 1.3 μm for Gaussian pulse: (A) system throughput, (B) system drop port.
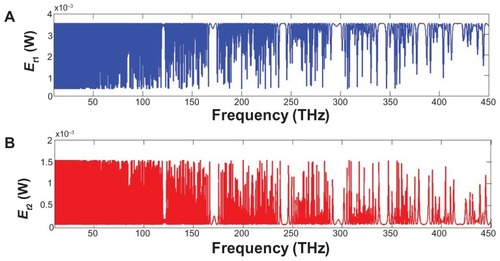
Figure 6 Expansion of simulation result of the channel frequency light pulse generated by the add/drop filter system.
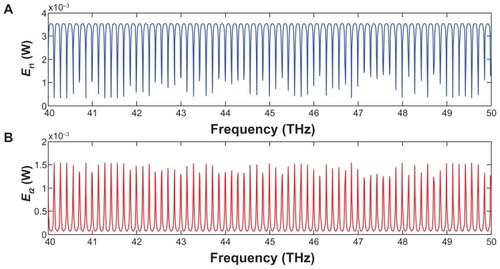
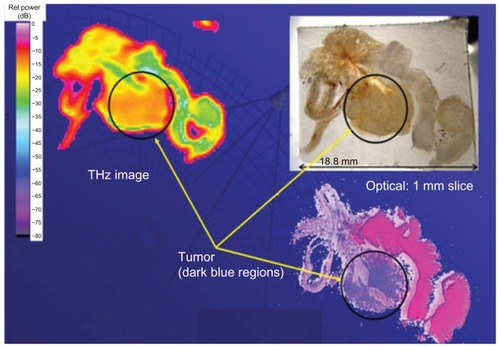
Figure 7 Prostate section with tumor tissue as imaged with terahertz, optical, and staining techniques.