Figures & data
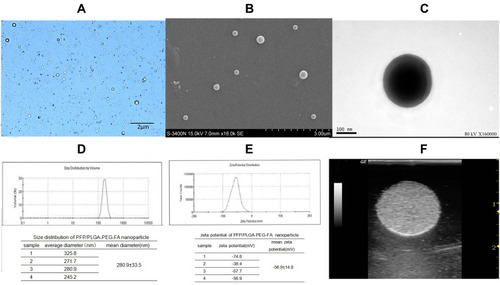
Figure 4 PFP/PLGA -PEG -FA nanoparticle characterizations.
Notes: (A) Bright field optical microscopy. (B and C) SEM and TEM image of the nanoparticles. (D and E) Size distribution and zeta potential of the nanoparticles. (F) In vitro US image of the nanoparticles.
Abbreviations: FA, folic acid; PEG, polyethylene glycol; PFP, perflenapent; PLGA, poly lactic-co-glycolic acid; SEM, scanning electron microscopy; TEM, transmission electron microscopy; US, ultrasound.