Figures & data
Figure 1 Physicochemical characterizations of AuNPs and their uptake in TM3 Leydig cells. (A) Transmission electron microscopy (TEM) images of AuNPs. Scale bars = 50 nm. (B) Particle size of AuNPs measured by dynamic light scattering (DLS). (C) Representative TEM images of TM3 cells after 24-h exposure of AuNPs (5 μg/mL). AuNPs were mainly entrapped in the endosome/lysosome but not in the nucleus (N). In addition, they may induce autophagy and were present in some autophagosomes (AP). The concentration (D) and time (E) dependent uptake of AuNPs in TM3 cells determined by inductively coupled plasma mass spectrometry (ICP-MS). TM3 cells were incubated with different concentrations of AuNPs for 24 h, or with 5 μg/mL AuNPs for different periods of time, respectively. Results are shown as mean ± SD (n=3). ** P < 0.01, *** P < 0.001.
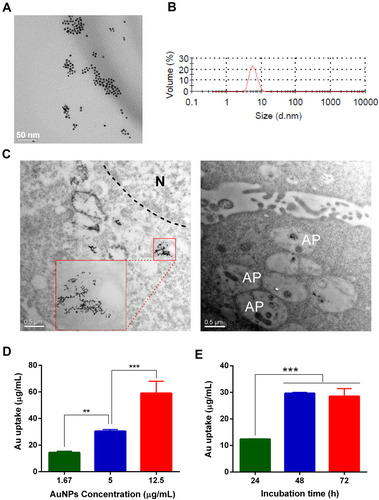
Figure 2 AuNPs-induced cytotoxicity and DNA damage in TM3 Leydig cells and their potential mechanisms. (A) The cell viability of AuNPs against TM3 cells was measured by MTT assay. (B) Representative images in the comet assay. (C) The DNA damage of TM3 cells exposed to different concentrations of AuNPs for 4 h or 24 h was measured by comet assay. Images of 100 randomly selected cells were analyzed using CASP software, and % DNA in the tail was chosen as a DNA damage parameter. Results are shown as mean ± SD (n=3). * P < 0.05, ** P < 0.01, compared to negative control. The intracellular ROS production in TM3 cells treated with AuNPs (12.5 μg/mL) was detected by confocal fluorescence microscopy (D) and flow cytometry (E), respectively. Scale bar: 200 μm. (F) Apoptotic or necrotic cell death of TM3 cells was detected by flow cytometry after 72-h incubation with 12.5 μg/mL AuNPs, followed by Annexin V-FITC and PI dual-staining. (G) The cell cycle of TM3 cells was analyzed by flow cytometry after 72-h incubation with different concentration of AuNPs. Results are shown as mean ± SD (n=3).
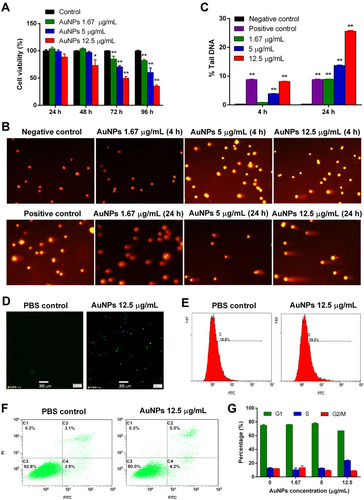
Figure 3 The effect of AuNPs on testosterone production in TM3 cells. (A) Testosterone concentration in the culture medium of TM3 cells after 24-h incubation with indicated concentration of AuNPs in the presence or absence of HCG. (B) Representative Western blot showing the expression of StAR and 17α-hydroxylase in TM3 cells after 24-h incubation with AuNPs. Actin was used as an internal control. The densitometric analysis of 17-hydroxylase (C) and StAR (D) expression relative to Actin in the Western blot. Results are shown as mean ± SD (n = 3). * P < 0.05, *** P < 0.001, compared to the PBS control. (E) Schematic diagram of testosterone synthesis in Leydig cells. StAR and 17α-hydroxylase are two of key proteins involved in the testosterone synthesis.
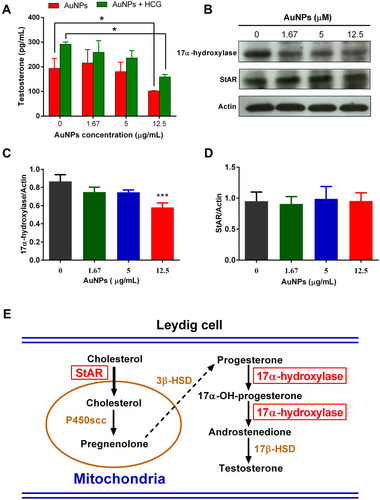
Figure 4 Toxicity and testicular accumulation of AuNPs in mice. (A) Scheme of experimental design in vivo. (B) Body weight of male mice treated with AuNPs throughout the experiment period. (C) ICP-MS analysis of Au contents in the testes of mice treated with AuNPs on days 14 and 21 (n=6). (D) TEM images of testicular sections in mice treated with 0.5 mg/kg AuNPs on day 14. Black dots (black arrow) in the section were gold nanoparticles, which were obviously present in the testicular section, mainly packed in the vesicles of interstitial cells, but not in the spermatogonia and sperm. The scale bar was 0.5 μm. ** P < 0.01.
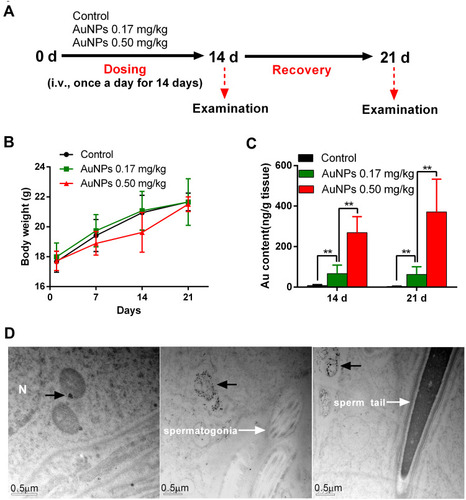
Figure 5 Effects of AuNPs on testicular weight, histology and testosterone production in mice. The weight of epididymis (A) and testis (B) of mice treated with AuNPs on days 14 and 21 (n=6). (C) Histopathological images of testicular tissue at 20x magnification (H&E staining). (D) The plasma testosterone in mice treated with AuNPs was detected using ELISA kit (n=6). (E) Representative Western blot showing the expression of StAR and 17α-hydroxylase protein in testis of mice treated with AuNPs. (F) Relative densitometric analysis of 17-hydroxylase and stAR expression in Western blot. The mean normalized optical density of these protein bands relative to that of Actin bands from the same sample was calculated. Expression levels of these proteins are expressed as fold changes compared with the control group. * P < 0.05, compared to the control group.
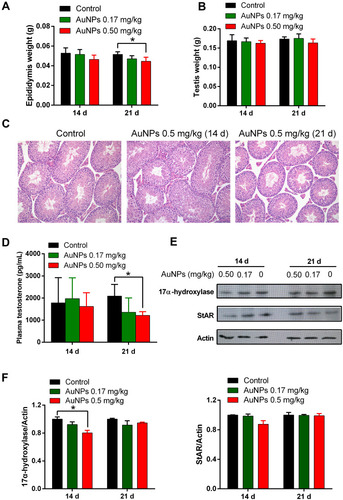
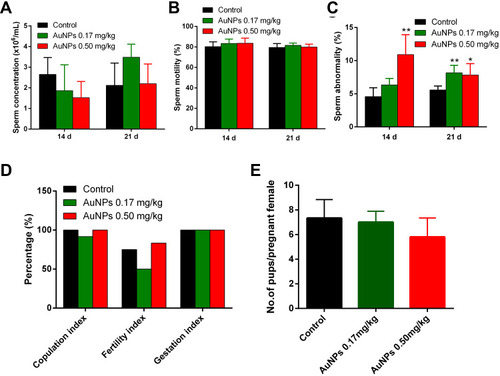
Figure 6 Assessment of sperm analysis, and fertility in mice treated with AuNPs. Sperm concentration (A), sperm motility (B), sperm abnormality (C) and fertility evaluation (D) of control and AuNPs-treated mice (n=6). Sperm concentration as counted with Neubauer haemocytometer. Abnormal sperm was determined by morphologic examination after 1% eosin staining. Copulation index (%) = (no. of animals with successful copulation/no. of animals paired) x100. Fertility index (%) = (no. of pregnant females/no. of females with successful copulation) x 100. Gestation index (%) = (no. of females that delivered live pups/no. of pregnant females) x 100. (E) The average number of pups/pregnant female in all the treatment groups (n=6). * P < 0.05, ** P < 0.01, compared to the control group.