Figures & data
Figure 1 Physicochemical characterization of peanut-shaped gold nanoparticles. Overview BF STEM (A1 and A2) and HRSTEM (A3). AuP NPs size distribution (B), zeta potential in different pH (C) and UV-Vis spectrum (D).
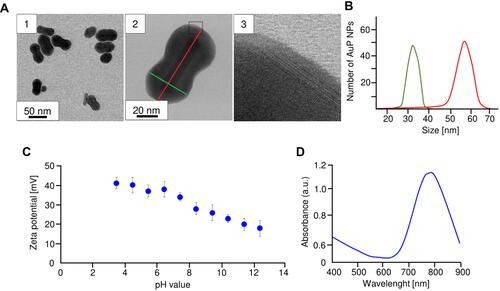
Figure 2 Cytotoxicity of peanut-shaped gold nanoparticles (AuP NPs) against human ovarian cancer SKOV3 cells. Decrease of cancer cell metabolic activity (A), DNA biosynthesis (B), and membrane permeability (C) upon treatment with peanut-shaped nanoparticles in doses ranging from 0.5–5 ng/mL for 24, 48, and 72 hours. Representative plots of flow-cytometry based analysis of cellular viability after 72 hour treatment of ovarian cells with peanut-shaped nanoparticles (D). Alterations in cellular morphology and confluence of cancer cells treated with AuP for 72 hours (E and F, respectively). *Statistical significance (P<0.05) when compared to untreated control cells. For panels (A–C) results from four independent experiments are shown. For panels (D, E, and F) one representative result is shown.
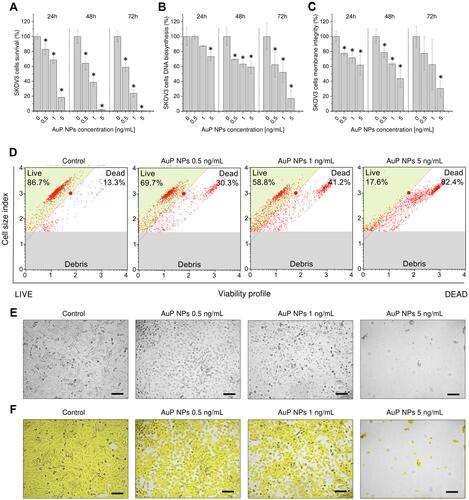
Figure 3 Disruption of oxidative balance in AuP NPs-treated ovarian cancer cells. Representative plots of flow-cytometry based analysis of GSH levels (A) and decrease of intracellular glutathione (GSH) concentration in treated cancer cells (B). Immunostaining of NADPH expression in AuP NPs-treated ovarian cancer cells (C). Induction of reactive oxygen species generation (D) and increase of number of cells with depolarized mitochondria (E) upon treatment with AuP NPs for 72 hours. For panels (A and C) one representative experiment is shown. For panels (B, D, and E) results are presented as mean±SD from three independent experiments. *Indicate statistical significance (P<0.05) when compared to untreated control cells. Scale bar ~10 µm.
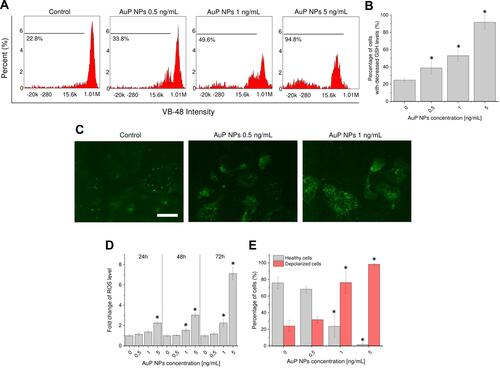
Figure 4 Involvement of JNK signaling pathway in AuP NPs-mediated killing. Distribution of cell viability; dead, PI-negative with low viability, and healthy cells (A) or dead, caspase-positive/dead, caspase-positive, and live cells (C) in samples of SKOV-3 cells treated with AuP NPs at doses of 0.5 and 1 ng/mL for 24 hours exclusively or pre-incubated with JNK inhibitor II prior to the addition of gold nanopeanuts. Relative alterations in cell population percentage upon JNK inhibitor II addition evaluated using Vitality assay (B) or MultiCaspase Assay (D). *Statistical significance (P<0.05) when compared to samples treated with AuP NPs without pre-incubation with inhibitor.
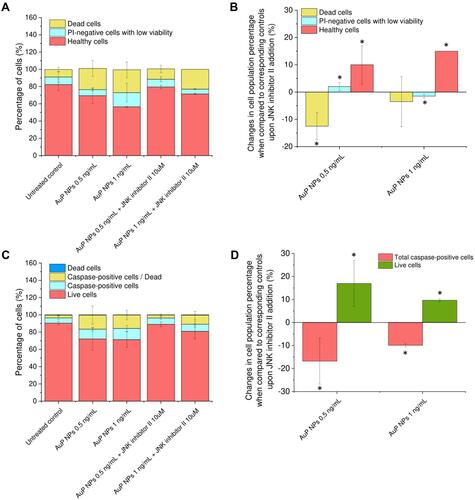
Figure 5 Mechanism of AuP NPs-induced apoptosis of ovarian cancer cells. Immunostaining of Annexin 1 (A), decrease of anti-apoptotic protein Blc-2 activity (B) and increase of number of caspase-positive cells (C) in AuP NPs-treated ovarian cancer cells. Western blot measurements of apoptotic proteins’ expression: cleaved-Caspase-3, cleaved-Caspase-9, cleaved-PARP, and cytochrome C oxidase subunit 4 isoform 1 (COX-IV) in AuP NPs-treated cancer cells. Representative blots and densitometry analysis are presented in (D) and (E), respectively. (F) The immunofluorescence images of ovarian cancer cells treated with AuP NPs when compared to untreated controls. Blue color indicates fluorescence of Hoechst 33,342 – nucleic acid staining, while green color -FITC or -AlexaFluor 488 – proteins staining. Scale bar ~10 µm. For panels (A, D, and F) representative results are presented. For panels (B, C, and E) results are presented as mean±SD from three independent experiments. *Statistical significance (P<0.05) when compared to untreated control cells.
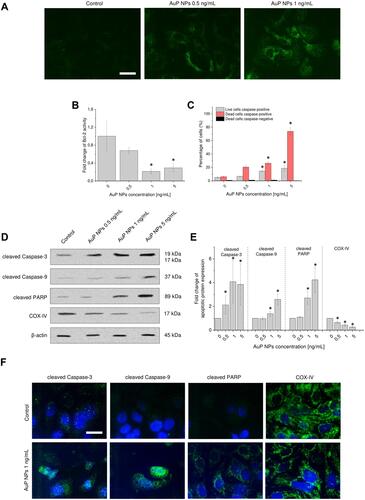
Figure 6 Induction of autophagy pathways in AuP NPs-treated ovarian cancer cells. Western blot measurements of expression of autophagic proteins: LC3A/B, Beclin-1, Atg12, and Atg7 in AuP NPs-treated cancer cells. Representative blots and densitometry analysis are presented in (A) and (B), respectively. (C) The immunofluorescence images of ovarian cancer cells treated with AuP NPs when compared to untreated controls. Blue color indicates fluorescence of Hoechst 33,342- nucleic acid staining, while green color -FITC or -AlexaFluor 488 – proteins staining. Scale bar ~10 µm. For panels (A and C) representative results are presented. For panel (B) results are presented as mean±SD from three independent experiments. *Statistical significance (P<0.05) when compared to untreated control cells.
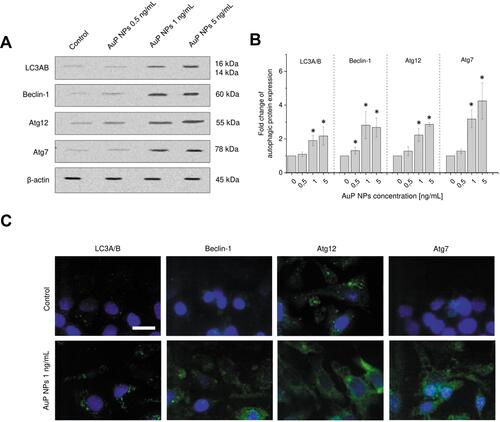
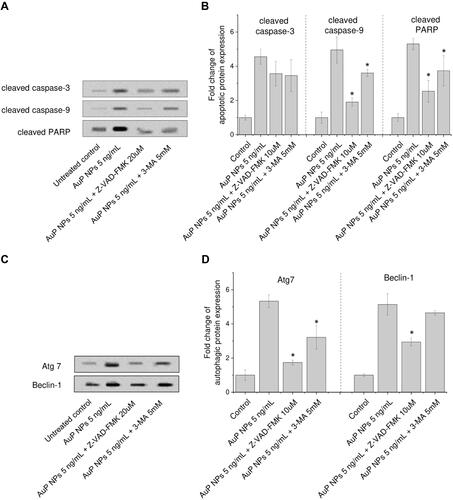
Figure 7 Western blot evaluation of apoptotic (A and B) and autophagic (C and D) proteins expression in human ovarian adenocarcinoma SKOV-3 cells upon treatment with peanut-shaped gold nanoparticles (AuP NPs) of 5 ng/mL for 24 hours. In this experiment, cells were pre-treated for 2 hours with signaling pathways inhibitors: apoptosis inhibitor (Z-VAD-FMK, 20 uµM), or autophagy inhibitor (3-MA, 5 mM). Results are presented as mean±SD from three independent experiments. *Statistical significance (P<0.05) when compared to samples treated with AuP NPs without pre-incubation with inhibitor.