Figures & data
Figure 1 Schematic representation of the fabrication procedure of deoxyribonucleic acid biosensor based on nanostructure gold electrode.
Abbreviations: AuE, gold electrode; DNA, deoxyribonucleic acid; HS, hydrosulfuryl; MCH, mercaptohexanol; RuHex, hexaamine-ruthenium III; SWORC, square-wave oxidation reduction cycle.
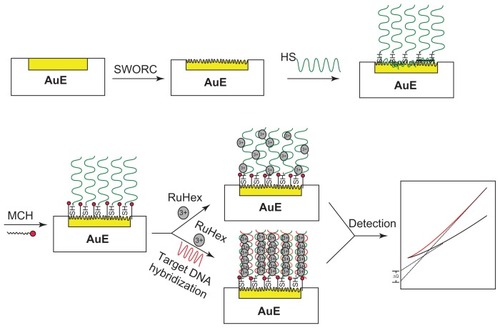
Figure 2 (A) Cyclic voltammograms of nanostructure gold electrode with different frequency in a solution of 0.5 M sulfuric acid at a scan rate of 100 mV/second. (a) 0 Hz, (b) 1000 Hz, (c) 2000 Hz, (d) 3000 Hz, (e) 4000 Hz, (f) 6000 Hz, (g) 12,000 Hz, (h) 10,000 Hz, and (i) 8000 Hz. (B) Effect of frequency on real surface area of nanostructure gold electrode by integration of the reduction peak of cyclic voltammograms in a solution of 0.5 M sulfuric acid at a scan rate of 100 mV/second (R = Ananostructure gold/Aplanar gold electrode). (C) Scanning electron microscopic image of the planar gold electrode and (D) after pretreatment of square-wave oxidation reduction cycle at 8000 Hz for 5 minutes.
Abbreviations: Ag, silver; AgCl, silver chloride; freq, frequency; vs, versus.
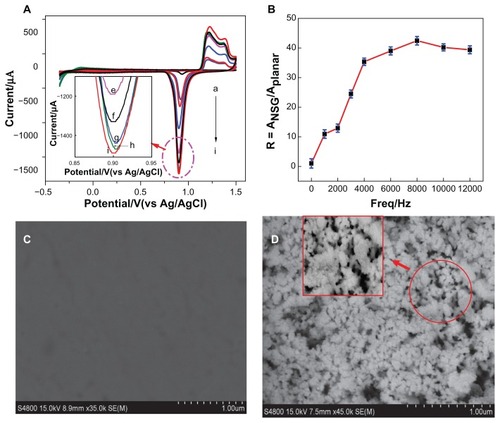
Figure 3 Impedance spectra (Nyquist plots) corresponding to (A) nanostructure gold electrode and (B) planar gold electrode. (a) Bare electrode, (b) after immobilization of capture probe, (c) after accumulation of hexaamine-ruthenium III to the single-stranded deoxyribonucleic acid, (d) hybridization with target deoxyribonucleic acid, and (e) after accumulation of hexaamine-ruthenium III to the double-stranded deoxyribonucleic acid.
Notes: Data were recorded in the presence of 10 mM iron-hexacyano complexes, [Fe(CN)6]3−/4−, as redox label. Biased potential was 0.08 V (versus silver/silver chloride) in the frequency range of 0.05–105 Hz and amplitude was 5.0 mV.
Abbreviation: Ret, electrotransfer resistance.
![Figure 3 Impedance spectra (Nyquist plots) corresponding to (A) nanostructure gold electrode and (B) planar gold electrode. (a) Bare electrode, (b) after immobilization of capture probe, (c) after accumulation of hexaamine-ruthenium III to the single-stranded deoxyribonucleic acid, (d) hybridization with target deoxyribonucleic acid, and (e) after accumulation of hexaamine-ruthenium III to the double-stranded deoxyribonucleic acid.Notes: Data were recorded in the presence of 10 mM iron-hexacyano complexes, [Fe(CN)6]3−/4−, as redox label. Biased potential was 0.08 V (versus silver/silver chloride) in the frequency range of 0.05–105 Hz and amplitude was 5.0 mV.Abbreviation: Ret, electrotransfer resistance.](/cms/asset/b0ff5949-ba35-4e0b-9772-b66f732920b7/dijn_a_27794_f0003_c.jpg)
Figure 4 (A) Cyclic voltammograms and (B) chronocoulometry curves for 20 μM hexaamine-ruthenium III as redox indicator at (a) double-stranded deoxyribonucleic acid modified nanostructure gold electrode, (b) single-stranded deoxyribonucleic acid modified nanostructure gold electrode, (c) double-stranded deoxyribonucleic acid modified planar gold electrode, and (d) single-stranded deoxyribonucleic acid modified planar gold electrode. Electrolyte was 10.0 mM tris buffer (pH 7.4) containing 20 μM hexaamine-ruthenium III.
Note: Scan rate = 50 mV/second, pulse period = 250 milliseconds.
Abbreviations: Ag, silver; AgCl, silver chloride; s, seconds; vs, versus.
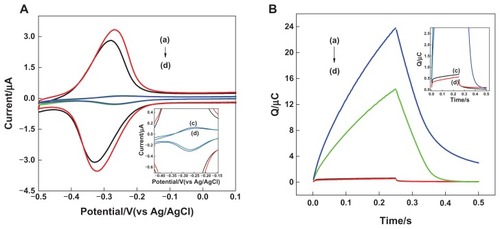
Figure 5 (A) Chronocoulometry curves using 20 μM hexaamine-ruthenium III as redox indicator for (d) probe-modified nanostructure gold electrode, and after hybridization with (a) complementary target sequence, (b) single-base mismatch sequence, and (c) noncomplementary sequence. (B) Chronocoulometry transients of hexaamine-ruthenium III for (d) probe-modified nanostructure gold electrode, and after hybridization with (a) complementary target sequence, (b) single-base mismatch sequence, and (c) noncomplementary sequence. (C) Chronocoulometry transients for nanostructure gold electrodes with capture probe hybridized with target DNA at a series of concentrations: (a) 0 M, (b) 20 fM, (c) 50 fM, (d) 100 fM, (e) 150 fM, (f) 200 fM, (g) 250 fM, (h) 1pM, (i) 10 pM, (j) 100 pM, (k) 1 nM, (l) 5 nM, and (m) 10 nM. (D) Calibration curve of the deoxyribonucleic acid sensor, where the definition of signal is the same as that in Figure 5C. Inset shows the plot of the charge increment of hexaamine-ruthenium III as a function of the target concentration. Concentration of target deoxyribonucleic acid was 50 fM, 100 fM, 150 fM, 200 fM, and 250 fM.
Notes: Error bars represent relative standard deviation of three independent experiments. Other experimental conditions are as described in .
Abbreviation: s, seconds.
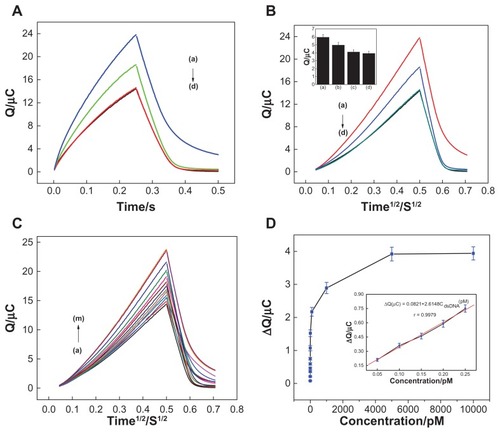
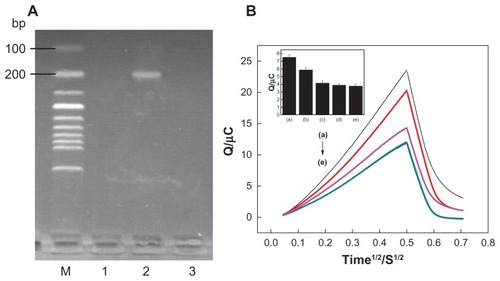
Figure 6 (A) Electropherogram of polymerase chain reaction products. The lanes from left to right: (1) negative real sample, (2) positive real sample, and (3) blank background. (B) Chronocoulometry transients using 20 μM hexaamine-ruthenium III as redox indicator for (e) probe-modified nanostructure gold electrode, (c) blank background, (b) after hybridization with the positive sample, (d) negative sample, and (a) the same concentration of target deoxyribonucleic acid.
Notes: Error bars represent relative standard deviation of three independent experiments. Experimental conditions are as described in .