Figures & data
Figure 1 (A) Colony morphology of FYS; (B) phylogenetic tree.
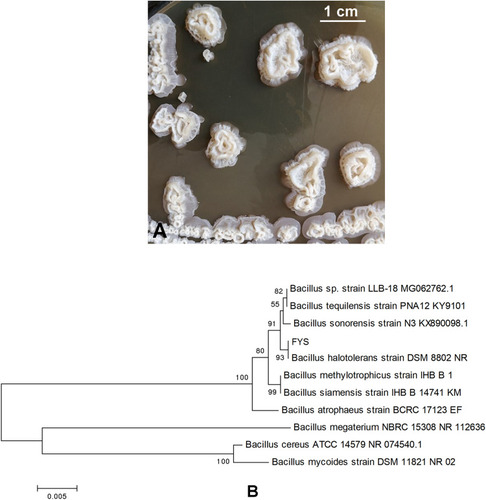
Table 1 Molecular Weights and Monosaccharide Ratio of EPS
Figure 2 (A) Lyophilized products of EPS; (B) microstructure by SEM (500×); and (C) microstructure by SEM (20,000×). (D) GPC; (E) standard curve of monosaccharide reference standard; and (F) EPS monosaccharide composition curve.
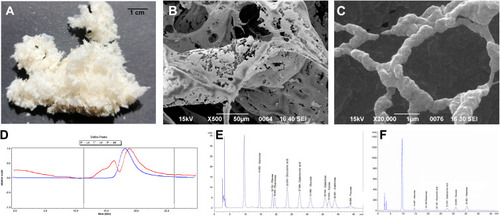
Figure 3 (A) Formation of nanoparticles when EPS changes with pH; (B) change in average particle size of EPS nanoparticles; (C) micromorphology of EPS nanoparticles by SEM (pH=6); (D) micromorphology of EPS nanoparticles by TEM (pH=6); (E) isoelectric point.
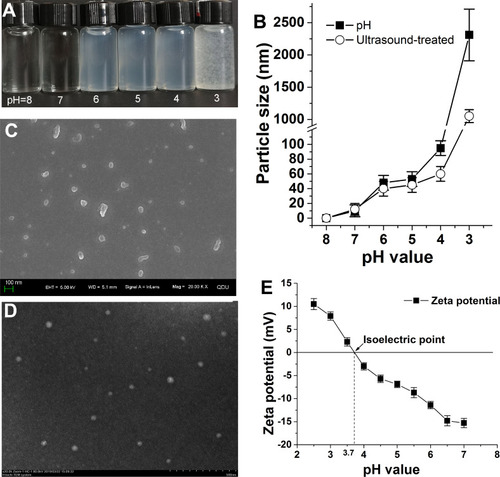
Table 2 E24 of EPS at Different pH and Concentrations (* p <0.05)
Figure 4 (A) The emulsifying activity of EPS at different pH (concentration is 0.75%); (B) emulsifying behavior of EPS at different concentrations (pH=6); (C and D) Nile red staining to observe the shape and size distribution of emulsions (concentration is 0.75%, pH=6).
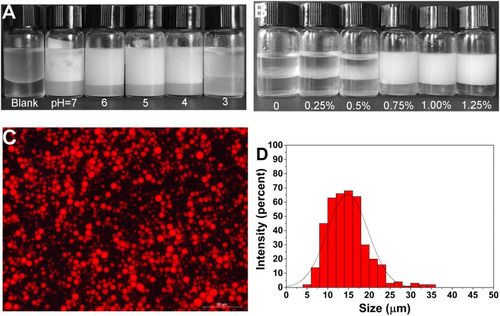
Figure 5 Response surface plot showing the significant (p < 0.05) interaction effect for droplet size as a function of (A) ultrasonic amplitude and ultrasonic time; (B) ultrasonic time and PEG400 content; (C) ultrasonic time and oil content; (D) PEG400 content and ultrasonic amplitude; (E) oil content and ultrasonic amplitude; and (F) PEG400 content and oil content.
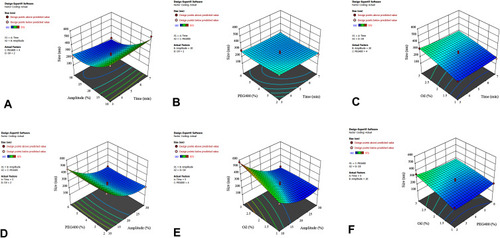
Figure 6 (A) NE type; (B) Tyndall effect; (C) droplet size distribution; (D) zeta potential; (E/F) morphology of ECPN at pH=6 by TEM (500 nm ×; 100 nm ×); (G) droplet size changes of ECPN stored at pH=6; and (H) storage stability of ECPN at different pH.
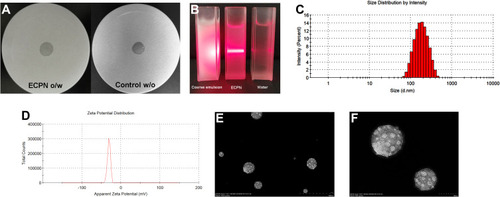
Figure 7 In vitro drug release profiles of ECPN.
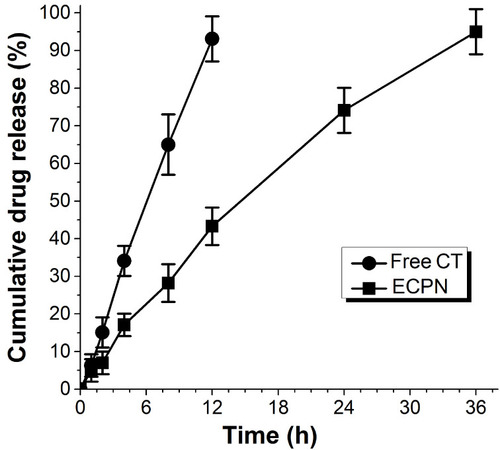
Table 3 PASI Score
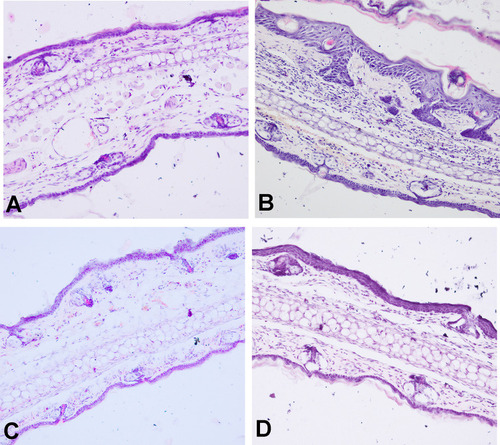
Figure 8 HE staining. (A) Healthy group (200 ×); (B) model group; (C) ECPN group; and (D) positive control group.